Most investors who look at American Airlines Group stop at the balance sheet. They see $34.89 billion in total debt and $7.91 billion in cash and decide the stock is uninvestable. That is a defensible conclusion. It is also an incomplete one.
The full picture of American Airlines stock debt risk 2026 requires looking at what the business generates alongside what it owes. And what it generates, specifically $4.87 billion in operating cash flow over the trailing twelve months, is the number that the pessimists consistently underweight in their analysis. This article makes the case for why the debt story is more nuanced than the headline number suggests, and where the genuine risk actually sits.
The Debt Number That Scares Everyone
American Airlines carries $34.89 billion in total debt. The market capitalization of the entire company is $9.82 billion. That means the debt load is more than three times the equity value the market assigns to the business. The enterprise value, which represents what you are actually paying to own everything including obligations, sits at $36.80 billion.
On a purely mechanical basis, this explains why the American Airlines stock balance sheet 2026 looks frightening on a screener. The current ratio is 0.49 times, meaning current liabilities are roughly double current assets. The quick ratio is even tighter at 0.35 times. The Altman Z-Score, a bankruptcy prediction model that combines five financial ratios, comes out at negative 0.15, which places the company squarely in what the model defines as the distress zone.
The AAL stock Altman Z-Score reading is worth understanding in context. The original Altman model was calibrated primarily on manufacturing companies in the 1960s. Airlines have structurally different balance sheet dynamics, particularly because aircraft assets tend to be financed through long-term debt and leases in ways that inflate the liability side of the model relative to the cash-generating capacity of the underlying fleet. The Z-Score is a useful input but not a definitive verdict on American Airlines financial health 2026.
Why the Cash Flow Story Changes the Calculation
The number that the AAL Z-Score cannot capture is the $4.87 billion in operating cash flow the business generated over the past twelve months. Operating cash flow measures what the core business produces before financing and investment decisions. It strips out the accounting noise that distorts net income at a heavily leveraged airline.
American Airlines also produced $861 million in levered free cash flow over the same period. Levered free cash flow is what remains after debt service obligations, meaning the company is generating positive cash even after paying interest on $34.89 billion in debt. That is not the profile of a company approaching imminent default.
The AAL stock cash flow analysis tells a different story than the balance sheet alone. A business generating nearly $5 billion annually in operating cash flow has a meaningful ability to service, refinance, and gradually reduce its debt load. The question is whether the rate of debt reduction is fast enough relative to the cost of carrying that debt in the current interest rate environment.
More From Tickzen:
- AAL Stock Before Earnings: Can the July 2026 Report Finally Close the $15 Gap to Fair Value
- American Airlines Stock (AAL) Technical Analysis 2026
- Is IREN Stock Overvalued at $61? What the Numbers Say Before You Buy
- EchoStar SATS Stock Analysis 2026: Is the 7x Rally Running Out of Steam?
- Nokia Stock Technical Analysis 2026: Is NOK Overbought or Setting Up for the Next Big Move?
The Profitability Gap and Why It Matters
Here is where American Airlines stock debt risk 2026 connects directly to the income statement. The gross margin is 22.87 percent. The operating margin is negative 0.07 percent. The net margin is 0.36 percent on a trailing basis, generating $202 million in net income on $55.99 billion in revenue.
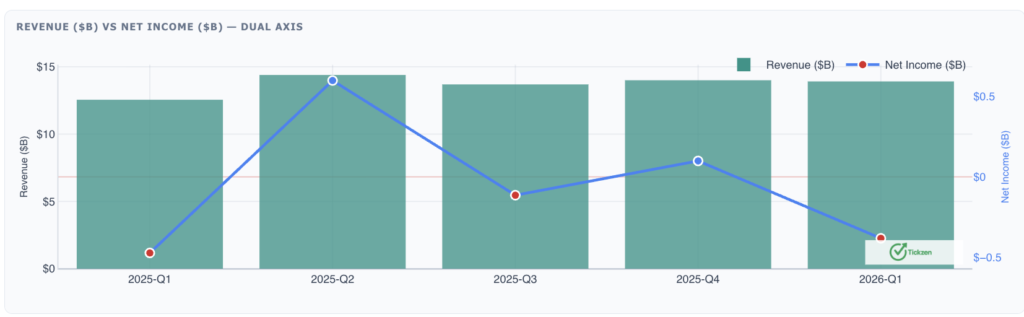
That journey from a 22.87 percent gross margin to a near-zero operating margin tells you exactly where the debt creates its most damaging effect. Interest expense on $34.89 billion at even a modest average rate consumes a substantial portion of gross profit before any ordinary operating expenses. Depreciation on a 1,013-aircraft fleet adds another enormous fixed cost. Together these two factors compress what would otherwise be a viable airline business into a company operating on margins where any revenue shortfall creates an immediate earnings problem.
This is the core tension in American Airlines financial health 2026. The business itself, measured by revenue growth of 10.8 percent, inventory turnover of 15.82 times, and receivables turnover of 26.99 times, is operationally efficient. The cash conversion cycle of just 13.1 days is excellent for a business of this size. None of that efficiency shows up in net income because the financing structure consumes the gains.
How This Compares to Delta and United
Delta Air Lines and United Airlines both carry debt. Delta has a debt-to-equity ratio of 1.05 times. United is at 1.95 times. American Airlines does not have a calculable debt-to-equity ratio because book equity is negative, which means total accumulated losses and distributions exceed total assets on a book basis.
Delta generates a 6.87 percent net margin and a 24.99 percent return on equity. United generates 6.06 percent net margin and 25.73 percent return on equity. American Airlines generates 0.36 percent net margin. The profitability gap is not small. It is the difference between an airline that is building shareholder value through its operations and one that is treading water at the margin level.
The peer comparison on AAL stock balance sheet 2026 confirms that the debt structure is the primary reason American Airlines trades at a fraction of the enterprise value of its two largest direct competitors. Delta has a market cap of $52.16 billion. United is at $34.38 billion. American Airlines is at $9.82 billion, despite operating a comparable network with 138,900 employees and hubs across nine major domestic cities plus international gateways.
The Bull Case Hidden Inside the Bear Case
This is where the analysis gets genuinely interesting for investors asking whether AAL stock is safe to buy. The bear case rests on the debt load being unmanageable. But the operating cash flow of $4.87 billion provides a plausible path to debt reduction if the business executes consistently over multiple years.
If American Airlines reduces its debt by even $3 billion annually over three years using operating cash flow, the interest burden drops materially. A lower interest burden improves the operating margin. A better operating margin produces a higher net income figure. And a higher net income figure against a forward PE of just 6.67 times would support a meaningfully higher stock price.
The Starlink partnership announced in May 2026 is part of this story because better in-flight connectivity supports higher ticket yields, particularly in premium cabins where the margin is widest. The UBS upgrade citing summer travel demand and lower fuel prices adds to the near-term revenue quality picture.
The AAL stock cash flow analysis shows a company that is not in free fall. It is a company carrying more debt than its equity value suggests it should, running on thin margins because that debt is expensive, but generating enough cash from operations to make the thesis survivable if the macro environment cooperates.
Tickzen.app runs exactly this kind of multi-layer analysis across fundamentals, technicals, and options flow for any stock. If you want to track how AAL’s debt reduction and margin trajectory develop quarter by quarter, it is worth bookmarking the full report there.
The Honest Risk Assessment for American Airlines Stock Debt Risk 2026
The genuine risk is not that the company goes bankrupt next year. The genuine risk is that a demand shock, a fuel spike, or a rise in refinancing costs prevents the debt from declining fast enough to matter for equity holders.
Airlines are the most cyclically sensitive major industry in the market. A recession that reduces business travel would compress yield and load factor simultaneously. At current margin levels, American Airlines has almost no buffer to absorb that scenario without generating losses that delay debt reduction by years.
Is AAL stock safe to buy depends on your definition of safe. The short answer is that it is not safe in the way that a diversified blue chip is safe. It is a high-conviction, high-volatility bet on the airline cycle staying favorable through at least the next two earnings reports.
For investors who understand that risk and believe the summer 2026 travel environment holds, the combination of a 101.9 percent implied upside to fair value and a Forward PE of 6.67 times represents a genuine opportunity. For investors who need capital preservation as the primary objective, the American Airlines stock debt risk 2026 profile makes this the wrong instrument.
This article is produced by Tickzen Insights for informational and educational purposes only. It does not constitute financial or investment advice. Always conduct independent research before making investment decisions.