
Snowflake stock jumped nearly 37% in a single after-hours session on May 27, 2026. That kind of move compresses weeks of price discovery into one night. If you were not already in position, you are now looking at a chart that has completely reset, and the most important question is not whether the earnings were good. They were. The real question is what the technical structure looks like at 175.26 dollars, and whether that structure supports adding exposure here or demands patience.
This is a complete Snowflake stock technical analysis covering every layer of the chart, from trend to momentum to volatility to options market pricing. By the end, you will have a clear read on the setup and the specific price levels that change the thesis in either direction.
How Snowflake Stock Is Positioned Against Its Key Moving Averages
The first thing any serious SNOW technical analysis 2026 has to establish is where price sits relative to its major trend lines.
SNOW stock price at 175.26 dollars is currently above the 50 day moving average of 153.04 dollars by a meaningful margin. That gap represents roughly 14.5% of separation, which reflects the velocity of the post-earnings move. Stocks that accelerate this far above their 50 day average in a short window often see mean reversion back toward that level before the next directional move begins. This does not mean the trend is broken. It means the easy money from the initial breakout has likely already been made.
The 200 day moving average at 202.49 dollars is a separate conversation entirely. SNOW stock price sits 15.5% below that level as of today. For long-term trend followers using the 200 day as their primary filter, Snowflake remains in a technical downtrend on the daily chart despite the recent surge. Reclaiming 202.49 dollars with a sustained close above that level is the single biggest structural upgrade the chart needs. Until that happens, the technical picture is correctly described as a recovery within a longer-term downtrend rather than a full trend reversal.
RSI and MACD Are Telling Two Different Stories
The RSI reading at 66.5 is the most nuanced data point in the current Snowflake stock technical analysis. It is elevated but not technically overbought. The conventional overbought threshold sits at 70, and at 66.5 there is still room for momentum to extend. In strong trending environments, RSI can run in the 60 to 75 range for weeks before a meaningful pullback materializes.
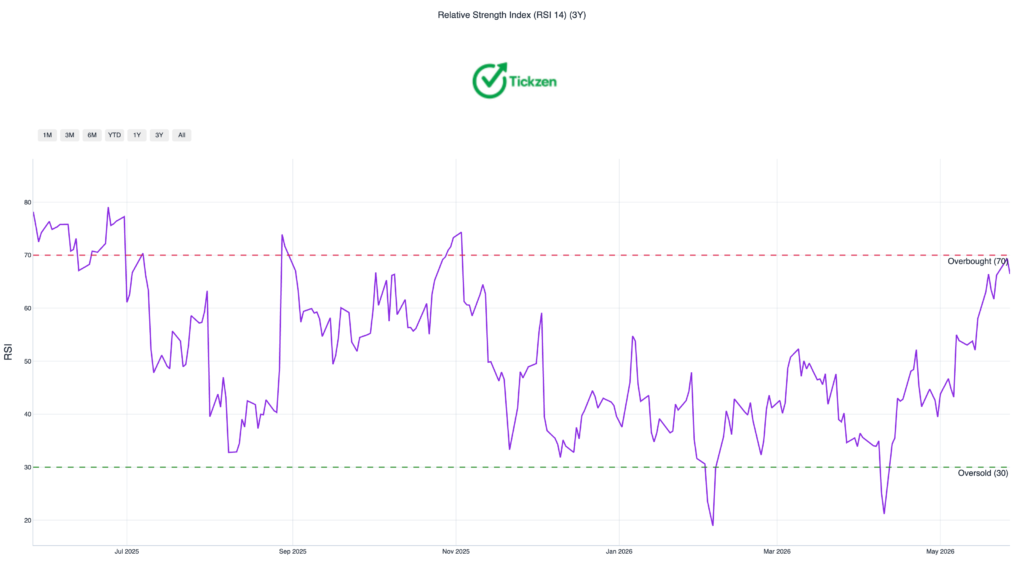
The risk is that 66.5 represents an entry point where the margin of error is thin. Stocks bought in this RSI range on momentum surges often deliver acceptable returns if the trend continues but punishing drawdowns if the move was a one-time catalyst spike rather than the beginning of a sustained trend. The SNOW earnings beat qualifies as a one-time catalyst. The follow-through volume and price action over the next two to three weeks will determine which camp this move falls into.
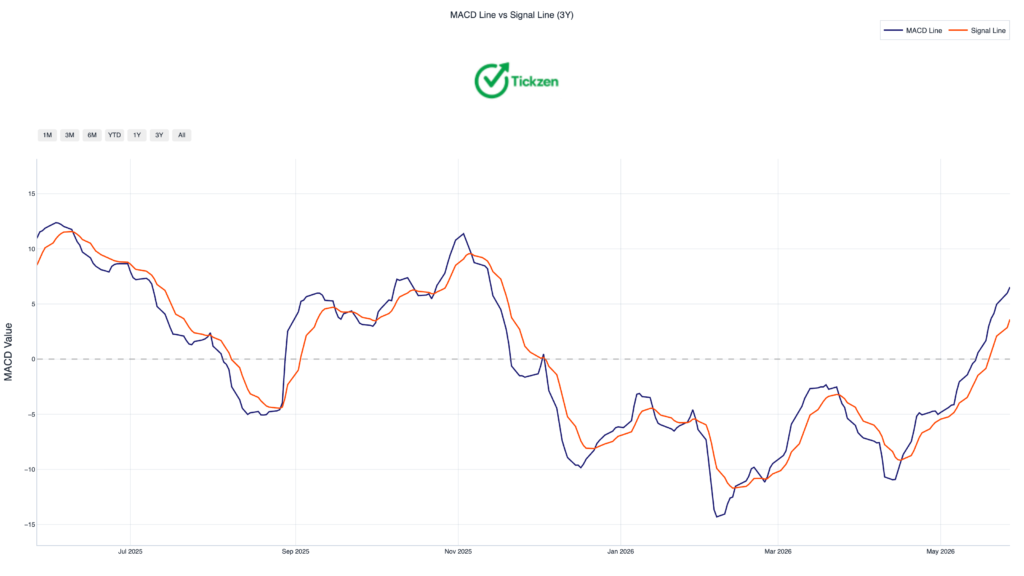
The MACD is currently in positive territory at 2.93, with the histogram confirming bullish short-term momentum. The MACD does not conflict with the RSI here. Both point to near-term strength. The divergence between the two comes in their forward implications. MACD confirms the current move. RSI warns that the move is extended and demands selectivity on new entries.
More From Tickzen:
- AAL Stock Before Earnings: Can the July 2026 Report Finally Close the $15 Gap to Fair Value
- American Airlines Stock (AAL) Technical Analysis 2026
- Is IREN Stock Overvalued at $61? What the Numbers Say Before You Buy
- EchoStar SATS Stock Analysis 2026: Is the 7x Rally Running Out of Steam?
- Adobe Inc. (ADBE) 2026 Outlook: 12-Month Forecast, RSI Signals & Risks
Snowflake Stock Support and Resistance Levels Worth Watching
Identifying the right Snowflake stock support and resistance levels after a 37% single-day move requires rethinking the map entirely. Old resistance levels flip to support in strong breakout environments.
The 153.79 dollar level was tested five times as resistance before the earnings move. That cluster of touches at the same price is one of the more reliable technical signals in the chart, and at current prices it represents a major support zone on any meaningful pullback. A retest of that level from above would be a structurally healthy consolidation.
The 148.18 dollar level sits below that and represents the next major cluster support, having been tested four times. A break below 148.18 dollars would shift the short-term thesis from consolidation to correction and open the door toward the 200 day moving average at 202.49 dollars from below.
On the upside, 180.77 dollars is the next meaningful resistance trigger. A sustained close above that level with above-average volume would confirm that this move has real buying conviction behind it and not just short-covering pressure from the earnings gap.
The 163.36 dollar level, which corresponds to the 20 day moving average, is the most important near-term line in the sand. As long as SNOW stock price holds above 163.36 dollars on a closing basis, the short-term bullish thesis remains intact. A close below it changes the immediate picture.
SNOW Stock Volatility and What the Options Market Is Pricing In
The volatility picture around SNOW stock in 2026 deserves real attention. The 30 day historical volatility measured close to close sits at 49.1%, which places this stock in the high-risk segment by any institutional standard. For context, the average large-cap technology stock runs at roughly 25 to 30% annualized historical volatility. SNOW stock volatility 2026 is nearly double that baseline.
The options market is amplifying this signal. Implied volatility at the nearest expiry sits at 85.5%, which ranks at the 100th percentile of its 52 week range. That means options are as expensive as they have been all year. For buyers of calls or puts, this is a significant headwind. Premium is priced to reflect maximum uncertainty, and buying premium at peak implied volatility is historically a low-probability approach.
The implied move priced into the June 26 expiry is plus or minus 19.1%, which translates to a 33.50 dollar straddle around the current price. The market is telling you directly that a move of nearly 200 dollars down to roughly 142 dollars or up toward 208 dollars is considered within normal probability by expiry. That is a wide distribution, and it demands respect from anyone sizing a position based on a directional view.
Bollinger Bands and Volume Context
SNOW stock price is currently trading in the upper half of its Bollinger Band range, between the 20 day moving average and the upper band. This positioning is consistent with a stock in short-term strength. The lower Bollinger Band sits at 129.82 dollars, which marks the outer boundary of a worst-case technical scenario if the current move fails to hold.
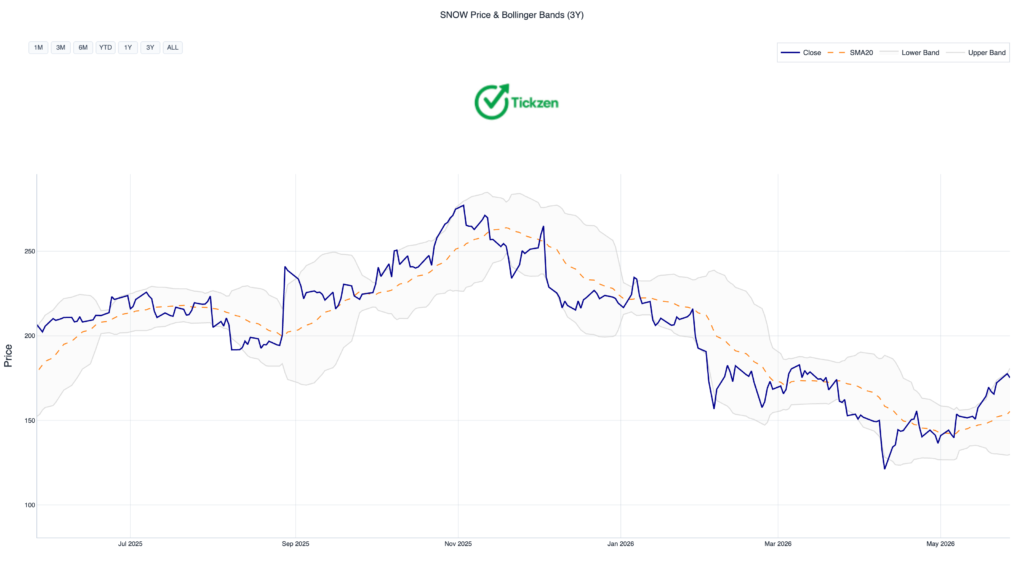
Volume is near its recent average following the initial surge. The peak volume day of the post-earnings reaction showed 17 million shares traded, which is above average. Subsequent days have moderated back toward the 5 to 7 million range. Volume at average levels during consolidation is a neutral signal. It would take a high-volume continuation above 180.77 dollars to confirm that institutional buying is genuinely committed to this price level.
Should I Buy SNOW Stock at Current Technical Levels
This is the practical conclusion of any Snowflake stock technical analysis. The answer depends on your time horizon.
Short-term traders who are asking should I buy SNOW stock at 175 dollars are working with an elevated RSI, stretched separation from the 50 day moving average, peak implied volatility, and the 200 day moving average still 15% overhead. The setup is not clean. Waiting for a pullback toward 163.36 dollars with volume confirmation gives you a better entry with defined risk below 153 dollars.
Long-term investors face a different calculation. The 200 day moving average at 202.49 dollars is the structural hurdle. SNOW technical analysis 2026 clearly shows that the long-term trend remains unresolved until that level is reclaimed. Investors who want to participate in the fundamental story without fighting the technical structure might consider scaling into a position rather than committing full size at today’s price.
The chart is not telling you to run. It is telling you to be selective. There is a meaningful difference between those two things.
This article is published for informational and educational purposes only. It does not constitute financial advice or a recommendation to buy or sell any security. Always conduct your own due diligence before making investment decisions.