
There are moments in the market when a stock moves so fast and so far that the excitement of the rally starts to work against you. American Airlines stock, trading under the ticker AAL, is sitting in exactly that position right now. As of May 27, 2026, AAL is priced at $14.85 and has delivered a 20.05% return in just the past three weeks. That kind of move turns heads. But if you are a disciplined trader or investor, the charts are telling a more nuanced story that deserves your full attention before you make a move.
AAL Stock Technical Analysis 2026: The Big Picture First
The most important thing to establish upfront is that the long-term trend for AAL stock is genuinely bullish as of today. The price is sitting above both its 50-day simple moving average at $11.80 and its 200-day simple moving average at $13.01. When a stock is above both of those levels, it tells you that buyers have been in control over both the medium and longer term. That is a foundation worth respecting.
The stock has also broken above a significant cluster resistance zone around $13.25, a level that was tested approximately 20 times before finally giving way. When a price level gets tested that many times and eventually breaks through, the conventional wisdom in technical analysis holds that old resistance tends to flip into new support. That means the $13.25 area now becomes a floor to watch on any pullback, which is an important data point for traders thinking about entry points.
Over the past year, AAL stock has traded in a range between $10.09 at its low and $16.50 at its high. The current price of $14.85 puts it comfortably in the upper half of that range, which means there is still a meaningful gap to the 52-week high but the stock is no longer dirt cheap relative to where it has been.
The RSI Problem: What Overbought Actually Means for AAL Stock
This is where the AAL stock technical analysis gets genuinely interesting and where many retail investors make a costly mistake. The 14-day Relative Strength Index for AAL is sitting at 72.8. Anything above 70 is considered overbought territory, and 72.8 is a meaningful reading that warrants caution.
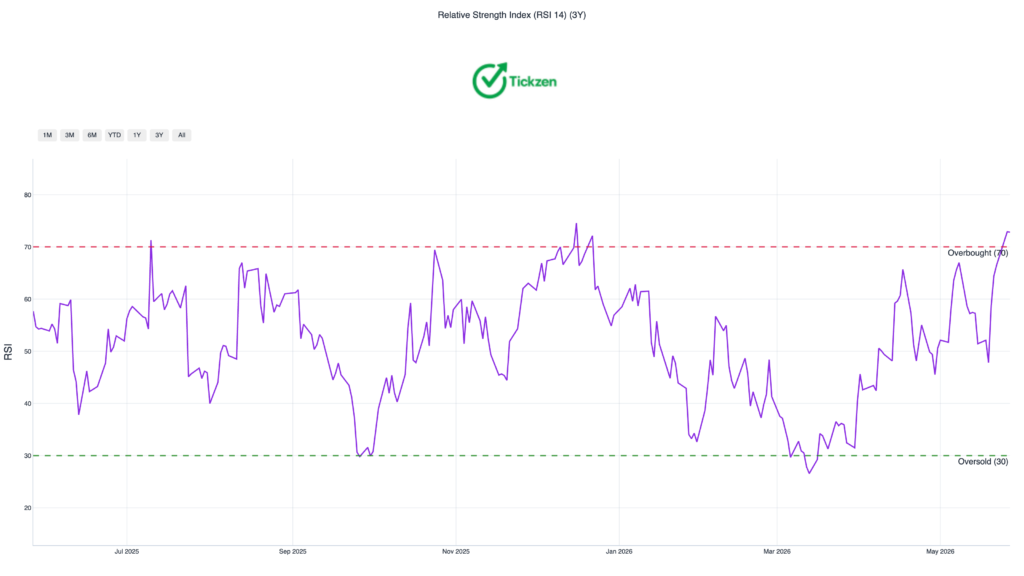
Here is the critical thing to understand about the RSI being overbought in the context of AAL stock right now. Overbought does not mean the stock is about to crash. It means the stock has run hard and fast, and the probability of a short-term pause or pullback rises significantly. Stocks can stay overbought for extended periods in strong trends, but the risk of buying at the top of a short-term move is real.
Historically, when stocks push through the 70-75 RSI zone, traders who chase the momentum often find themselves buying just before a consolidation phase kicks in. The smarter approach is to wait for the RSI to cool back toward the 60 or even 55 level before adding new exposure. That kind of patience typically rewards you with a better entry price and a more favorable risk-to-reward setup.
MACD and Bollinger Bands: Reading the Full American Airlines Stock Chart
The MACD indicator for AAL stock is currently showing a positive histogram reading of 0.22, which confirms that short-term upward momentum is still present. The MACD measures the difference between two moving averages, and a positive histogram reading tells you that the shorter-term average is still above the longer-term average. That is a bullish signal in isolation.
However, the Bollinger Band picture adds important context to the American Airlines stock chart. The price is currently walking the upper Bollinger Band, with the upper band sitting at $14.71 and the current price above it at $14.85. When a stock trades persistently above its upper Bollinger Band, it can signal trend continuation, but it also signals that the stock is stretched relative to its recent volatility baseline.
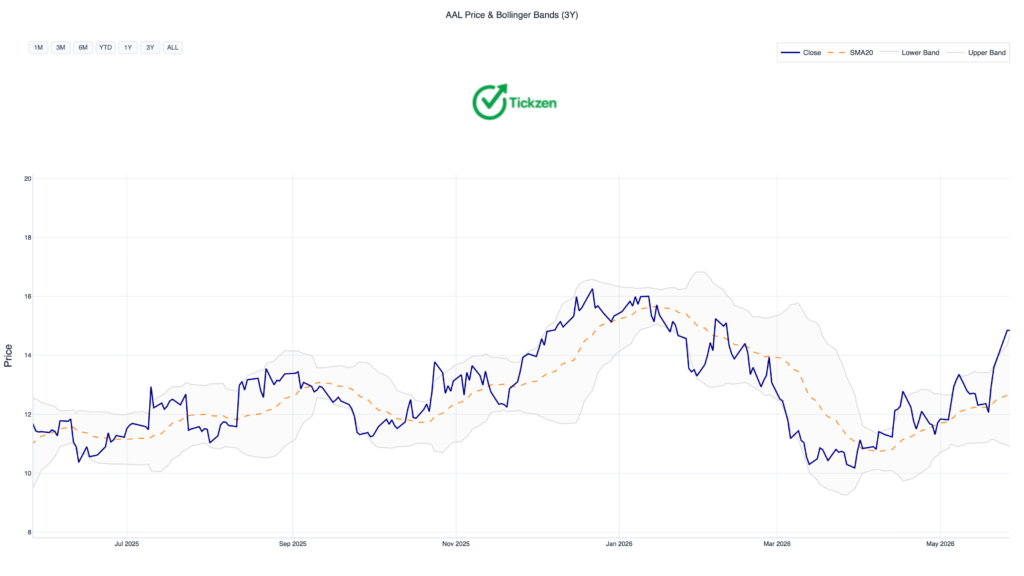
The lower Bollinger Band sits at $10.91, which gives you a sense of the full range the model is pricing in. If the short-term momentum stalls and the price breaks below the 20-day moving average at $13.20, that lower band level becomes a realistic destination for a deeper correction.
The volume picture is arguably the biggest concern in the current AAL stock technical analysis. The rally over the past three weeks has not been accompanied by expanding volume. Volume has been running at or below its 20-day average on many of the up days. Strong, sustainable price moves tend to be confirmed by increasing participation from buyers. When prices rise on weak volume, it raises the risk that the move is driven by a thinner group of participants and could fade quickly when that buying pressure subsides.
Key Support and Resistance Levels: Your Practical Trading Map for AAL
Understanding the specific price levels that matter is what separates a trading plan from a vague opinion. Here is how to think about the key zones on the AAL stock chart right now.
The first line in the sand is $13.20, which is the 20-day moving average. As long as AAL holds above this level on a closing basis, the short-term bullish trend remains intact. A close below $13.20 would be a meaningful warning signal, likely triggering a test of the next support cluster.
The second critical level is $13.01, which is where both the 200-day moving average and a major price cluster support zone converge. This level has been tested roughly 20 times historically, making it a genuinely important floor. A sustained breakdown below $13.01 would shift the technical picture meaningfully and could open the door to a deeper correction toward the 50-day moving average at $11.80.
On the upside, a sustained and volume-confirmed move above $14.71 would validate the continuation case and could open up a run toward the 52-week high at $16.50. That would be the breakout signal that aggressive traders are waiting for.
More From Tickzen:
- Is IREN Stock Overvalued at $61? What the Numbers Say Before You Buy
- EchoStar SATS Stock Analysis 2026: Is the 7x Rally Running Out of Steam?
- Nokia Stock Technical Analysis 2026: Is NOK Overbought or Setting Up for the Next Big Move?
- ASTS Stock Technical Analysis 2026: What the Charts Are Really Telling You Before the Next Big Move
- AST SpaceMobile Stock Fundamental Analysis 2026: Is ASTS Worth $31 Billion Before It Even Turns a Profit?
American Airlines Stock Trading Strategy: How to Position Based on Your Goals
Short-term traders looking at the AAL stock price prediction for the coming weeks should be cautious about adding new positions at the current level. The RSI at 72.8 combined with below-average volume on the rally creates a meaningful risk that you are buying into a short-term peak. The more disciplined approach is to wait for either a pullback toward the $13.20 support zone or a confirmed high-volume breakout above $14.71.
Long-term investors have a different calculation. The 200-day moving average at $13.01 remains well below the current price, and the overall trend structure is constructive. For anyone with a multi-quarter horizon, a pullback toward the $11.80 to $13.20 range would represent a genuinely attractive risk-adjusted entry point, assuming the fundamental story remains intact.
New buyers considering AAL stock in 2026 should resist the temptation to chase this rally. The 14.72% gain over just 15 days is impressive, but it also means the easy money has likely already been made on this particular leg up. Patience here is not weakness. It is how you protect yourself from the most common retail investor mistake, which is buying momentum at its peak.
What Drives the Volatility in AAL Stock
Part of what makes AAL stock so active right now is its structural volatility profile. The stock carries a beta of 1.28 relative to the broader market, meaning it tends to move about 28% more than the S&P 500 in either direction. The 30-day historical volatility on a close-to-close basis is running at 51.5%, which is above the full-history average of 44.5%. Options markets are pricing in an implied move of roughly plus or minus 13.6% through the next monthly expiration on June 26, 2026. That is a wide range by any measure.
Recent catalysts adding to the volatility include a significant UBS upgrade citing easing geopolitical tensions and expectations for strong summer travel demand, as well as a high-profile partnership announcement with SpaceX’s Starlink to equip more than 500 narrow-body aircraft with satellite internet connectivity. Both of those developments contributed to the sharp move higher in late May.
The Bottom Line on AAL Stock Technical Analysis in 2026
The honest technical verdict on American Airlines stock right now is that the trend is your friend but the timing is not. The long-term chart structure remains bullish, the price is above key moving averages, and recent news flow has been positive. All of that is real and worth acknowledging.
But the RSI is overbought, volume has not confirmed the rally with conviction, and the stock has already moved more than 20% in three weeks. Those are the ingredients for a healthy pause or pullback, not necessarily a reversal, but enough to make chasing the stock at $14.85 a higher-risk proposition than it was just a month ago.
The smartest move right now is to define your levels, know where you would buy on a pullback, know where you would cut losses if support breaks, and let the market come to you rather than the other way around. That kind of discipline is what separates traders who survive long-term from those who get caught buying the top of every exciting move.
This article is written for informational and educational purposes only. It does not constitute financial or investment advice. Always conduct your own research and consult a qualified financial advisor before making investment decisions.
2 thoughts on “American Airlines Stock (AAL) Technical Analysis 2026”