Atlassian jumped 15% in a single trading session on May 29, 2026, closing at $107.61. The software sector was catching a bid, AI optimism was spreading from Snowflake’s blowout quarter, and money rotated back into enterprise software names. TEAM rode that wave hard.
But momentum is not thesis. Before buying into a 15% gap-up, investors deserve a clear answer to the fundamental question: what is Atlassian actually worth right now?
This article is a complete look at Atlassian stock valuation and technical setup in 2026, using current data from Tickzen’s research model. No filler. Just the numbers and what they mean.
Is TEAM Stock Overvalued at $107?
The headline numbers are interesting. Atlassian trades at a forward P/E of 17.34x and a PEG ratio of 0.71x. For a software company growing revenue at 31.7% year-over-year, a PEG below 1.0 typically signals that growth is being underpriced. On that metric alone, TEAM does not look expensive.
The fair value estimate from a blended model combining analyst consensus, P/E implied value, and EV/revenue multiple comes in at $143.90. That is 33.7% above the current price. The analyst consensus target from 31 Wall Street analysts sits at $143.18, with a median of $120 and a high target of $480.
So on paper, TEAM looks undervalued. But there is a catch that most screeners will not show you.
Atlassian’s trailing EBITDA is negative $51.77 million. The EV/EBITDA multiple is negative 529x, which is mathematically meaningless as a valuation tool. The operating margin is negative 1.97%. Net income over the trailing twelve months is negative $216.81 million. The company is spending well ahead of its profitability.
This is not unusual for high-growth enterprise software. Atlassian is investing aggressively in R&D, sales infrastructure, and AI product development across Rovo and Jira’s expanded feature set. The gross margin of 84.81% is exceptional and confirms the core business model works. The gap between gross margin and net margin is entirely explained by operating expense choices, not broken unit economics.
The question is whether those operating expense choices pay off fast enough to justify current prices. At 4.41x price-to-sales and an enterprise value of $17.28 billion, investors are paying for a profitable Atlassian that does not yet exist in the income statement.
Atlassian Fair Value Estimate Breakdown
Three models feed the $143.90 fair value estimate, each weighted differently based on data reliability.
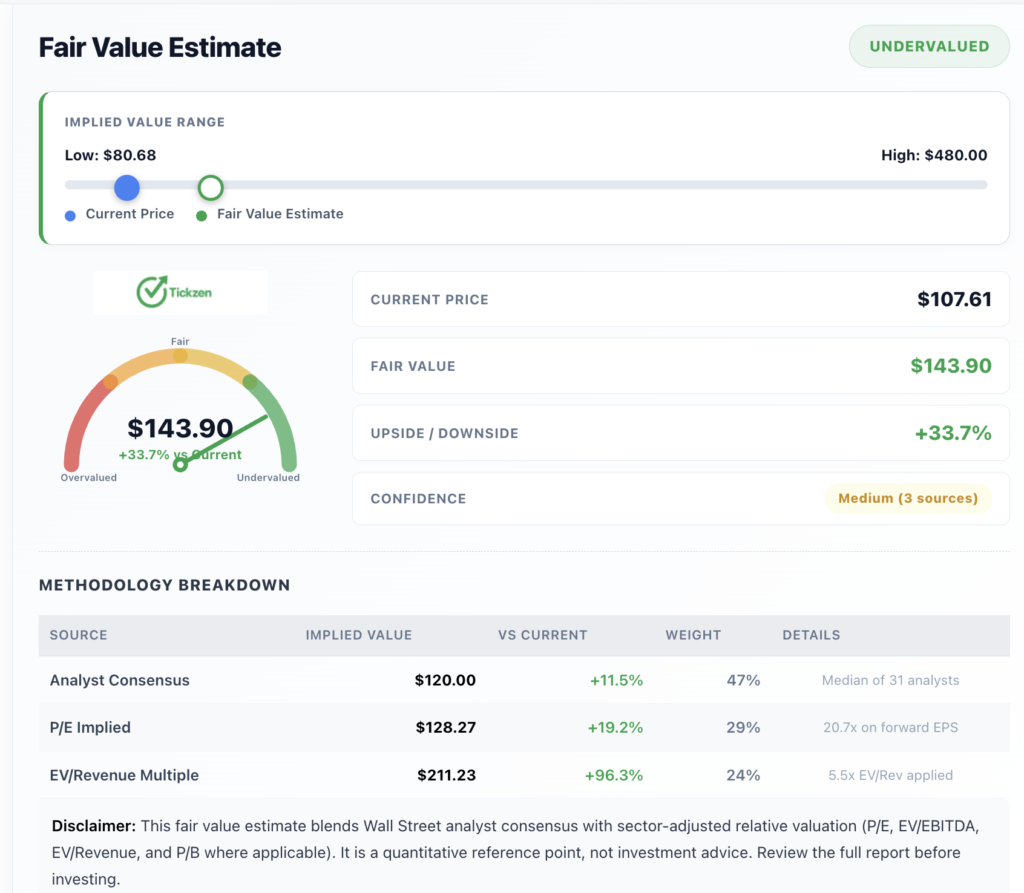
Analyst consensus from 31 analysts gives an implied value of $120 at the median, weighted at 47% of the final estimate. This is the most conservative input and the most grounded in near-term expectations.
A P/E implied value of $128.27 is derived from applying 20.7x to forward EPS, weighted at 29%. This reflects what the stock would be worth if it were trading at a multiple in line with profitable software peers.
An EV/revenue multiple analysis applies 5.5x EV/Revenue and arrives at $211.23, weighted at 24%. This is the most aggressive input and reflects the premium that high-growth software companies have historically commanded.
Blended together, the fair value estimate is $143.90, giving the stock 33.7% upside from $107.61. The confidence on this estimate is medium, sourced from three independent methodologies that converge in a similar range.
The spread from $80.68 on the low end to $480 on the high end tells you analysts have very different views on how fast Atlassian reaches profitability and how large the TAM ultimately proves out. That spread is itself a risk signal worth respecting.
TEAM Stock Technical Analysis 2026: The Chart That Does Not Lie
The technical picture for TEAM in 2026 is genuinely mixed, and that word “mixed” is doing real work here.
The stock is above its 50-day moving average, which sits at $76.12. That is a 41% gap between the 50-day and the current price, which reflects just how compressed the stock was before this month’s bounce. It also means the 50-day is not providing useful near-term guidance yet.
The 200-day moving average is $125.01. The current price of $107.61 is 14% below that level. Until TEAM reclaims $125 on a closing basis with sustained volume, the long-term trend remains broken. That is not a peripheral technical detail. The 200-day is the benchmark that institutional investors use to define trend health.
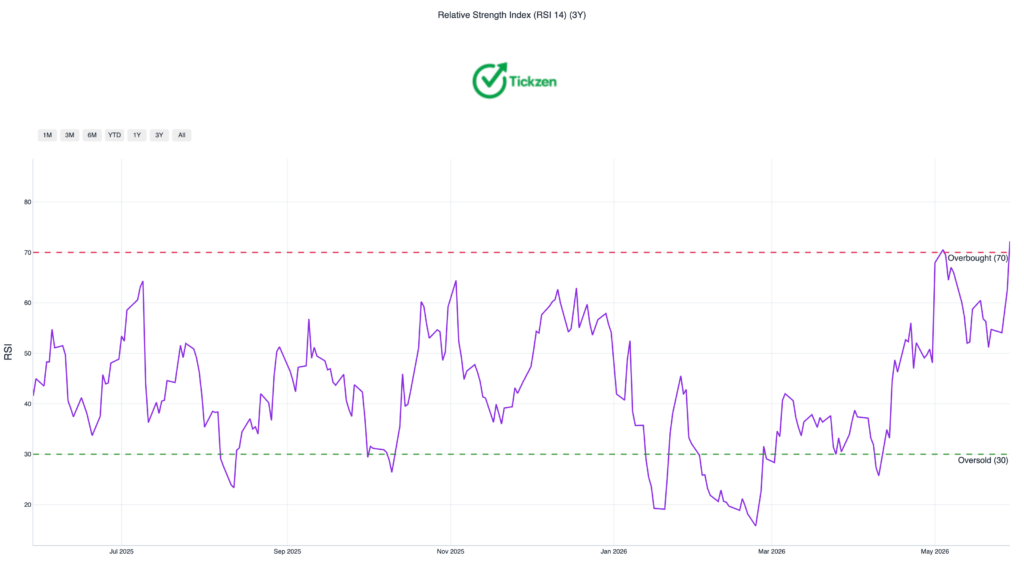
RSI at 72.2 is in overbought territory. Historically, RSI readings above 70 in a stock that has already run 17.48% in 15 days produce one of two outcomes: either the momentum continues with broader sector confirmation, or the stock consolidates or pulls back before the next move higher. The MACD is positive and supports ongoing short-term momentum, but MACD and RSI together do not resolve the overarching ambiguity of being below the 200-day.
The 52-week range of $56.01 to $222.59 is the most telling single data point in the entire technical picture. Atlassian has lost more than 51% of its value from peak. The current price represents a recovery from the lows, not a return to strength.
Bollinger Bands show the price walking above the upper band at $100.41, which can confirm trend continuation but also flags the stock as extended in the near term. Key support levels are $88.24 (the 20-day moving average) and $83.62, which has been tested 11 times and held. A clean break below $83.62 would open a test toward the 200-day SMA.
For investors asking whether now is the right time to buy TEAM based on technical analysis, the honest answer is that the short-term setup is extended and confirmation is still missing above $125. The better entry, if the thesis is right, is on a controlled pullback to the $88 to $90 zone.
What Atlassian Stock Price Prediction Requires Getting Right
The Atlassian stock price prediction for 2026 and beyond hinges on one assumption above all others: margin expansion.
Revenue growth at 31.7% is real and accelerating. The business generates $1.25 billion in operating cash flow, which proves the underlying engine works. But the market is paying a premium for a version of Atlassian that has translated that revenue growth into operating profitability. Until the operating margin turns positive and sustains above 10%, valuation models will stay wide and price targets will stay dispersed.
The bull case is clear. Atlassian’s products are embedded in how engineering teams globally work. Jira, Confluence, and Loom are not replaced easily. The AI layer through Rovo adds a defensible moat as enterprise AI spending accelerates. Institutions own 108.78% of the float, which signals strong conviction from professional investors.
The bear case is equally clear. Short interest jumped from 13 million to 20 million shares between April and May 2026. That increase of 7 million shares in one month is not noise. Insiders have executed 36 sell transactions against 2 buys over the past three months. Insider ownership is only 0.96%, meaning management has limited personal stake in the outcome.
The liquidity picture adds another layer. The current ratio of 0.70x means current liabilities exceed current assets. Debt is $1.24 billion. Cash is $1.14 billion, a slight net debt position. The Altman Z-Score of negative 0.20 places Atlassian in financial distress territory technically, though the operating cash flow buffer is substantial.
The Atlassian Stock Outlook for Long-Term Investors
TEAM stock at $107 is not obviously a buy or a sell. It is a company with a genuinely strong business model, real cash generation, and a credible path to profitability, trading on sector sentiment at a price that requires everything to go right over the next 12 to 18 months.
For long-term investors, the thesis depends entirely on margin trajectory. If Atlassian delivers a quarter showing operating margin improvement alongside 25% or higher revenue growth, the stock will re-rate meaningfully toward the analyst consensus range of $120 to $143. That is where the Atlassian stock analysis becomes actionable.
Buying at $107 after a 15% gap-up requires accepting that you are paying for a recovery that is already underway. Waiting for confirmation above the 200-day moving average at $125 means paying more, but with significantly clearer technical backing.
The data says the upside is real. It also says the risk is underpriced at current levels. That is the complete picture.