
The stock hit $448.90 on May 29. Here is what the charts are telling long-term investors and short-term traders right now.
Broadcom stock has had a remarkable run. Over the past year, AVGO gained 86.1%, beating the S&P 500 by 57.8 percentage points and outpacing even the Nasdaq 100 by nearly 44 percentage points. As of June 1, 2026, the stock closed at $446.77, just a few dollars below its 52-week high.
That kind of performance creates a specific problem for investors: what do you do when a stock you believe in is also at or near its highest price ever? Buying at the top feels reckless. Missing a continued move upward feels worse. Getting the technical picture right matters here, because the technical analysis of AVGO right now is not as clean as the one-year return suggests.
AVGO Price Trend and Moving Average Analysis
Start with the big picture. Broadcom is trading well above both its 50-day simple moving average of $385.70 and its 200-day simple moving average of $352.30. The gap between the current price and the 200-day SMA is roughly $94, or about 21%. That is a meaningful extension from the long-term trend line.
The 50-day SMA is the more relevant near-term benchmark. At $385.70, it represents a potential area of support if the stock pulls back, but getting there from $446.77 would require a roughly 13.7% decline. For context, that kind of drawdown has happened to AVGO before. The maximum historical drawdown on record is 48.30%, and the stock fell from above $420 to below $420 multiple times during the May trading range.
The 20-day SMA at $425.52 is the most immediate support level to watch. As long as AVGO holds above this level on a closing basis, the near-term uptrend stays intact. A close below $425.52 would be the first technical signal that momentum is weakening.
AVGO RSI and Momentum Indicators
The RSI reading of 65.9 is one of the more nuanced data points in this analysis. RSI in the 65 to 75 range does not automatically mean a stock is overbought. In strong trending markets, stocks can hold elevated RSI readings for extended periods. But it does mean the stock has less cushion than it would at RSI 50 or below.
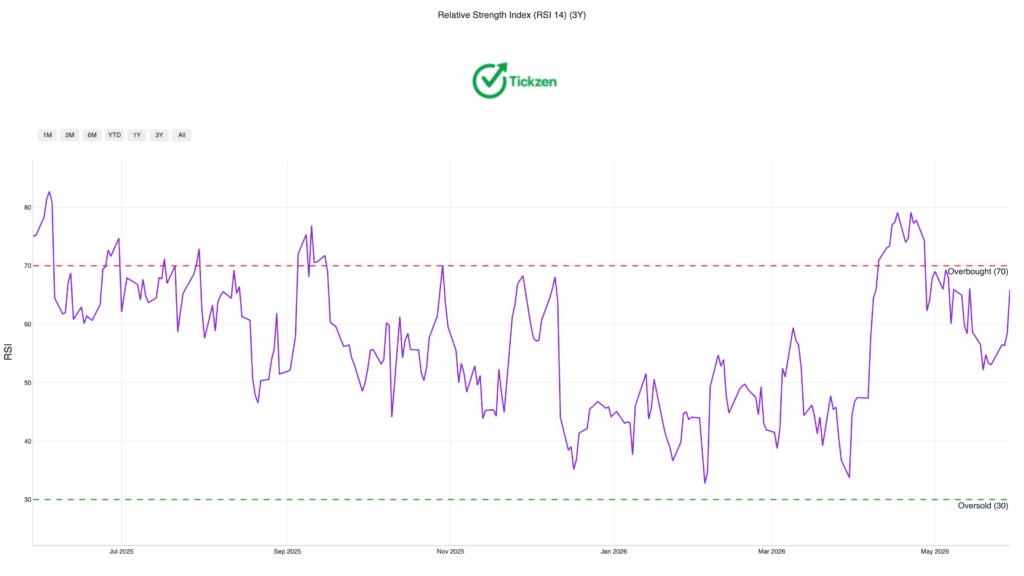
What matters more here is the trajectory. The RSI is elevated and approaching overbought territory as the stock pushes toward its 52-week high. If RSI continues climbing past 70 while price advances, that confirms momentum is intact. If RSI starts declining while price holds flat or grinds higher, that divergence is a warning sign.
The MACD reading of negative 0.91 is more directly concerning. The MACD histogram turned negative, which means the short-term moving average has crossed below the longer-term moving average. That is a bearish signal for near-term price momentum. It does not override the longer-term bullish trend. But it does suggest that the aggressive buying that drove AVGO from $405 in mid-May to $448.90 by May 29 may be losing steam.
When RSI is elevated and MACD is turning negative at the same time, the most likely outcome is a consolidation phase rather than a continuation of the recent sharp move. The stock needs to either rest or pull back before the next meaningful leg higher.
More From Tickzen:
- AAL Stock Before Earnings: Can the July 2026 Report Finally Close the $15 Gap to Fair Value
- American Airlines Stock (AAL) Technical Analysis 2026
- Is IREN Stock Overvalued at $61? What the Numbers Say Before You Buy
- EchoStar SATS Stock Analysis 2026: Is the 7x Rally Running Out of Steam?
Broadcom Stock Support and Resistance Levels
The Bollinger Band analysis adds useful context. AVGO is trading above the upper Bollinger Band at $440.68. Stocks that walk the upper band in strong trends can stay there for a while, but when that move coincides with a negative MACD and RSI near 66, the probability of a pullback increases.
Three specific levels matter right now.
The first is $434.05. This level was tested six times as resistance before the recent breakout. When a resistance level gets tested that many times and finally breaks, it usually becomes support on the way down. A pullback to this area, if it comes, would likely find buyers.
The second level is $425.52, the 20-day moving average. A close below this level would suggest the short-term momentum has shifted. It would not be catastrophic, but it would change the trading picture enough that new buyers should wait.
The third is $415.50, which showed up as cluster support based on six separate tests. A break below $415.50 would be the more serious signal, potentially opening a path toward the 50-day SMA at $385.70.
On the upside, $440.68 is the immediate trigger. A sustained move above the upper Bollinger Band with above-average volume would confirm that the trend is resuming rather than exhausting.
AVGO Volatility and Risk Profile for Traders
The 30-day historical volatility of 39% annualized is high. For context, the full-history average HV for AVGO is 33%, so the current reading is elevated relative to its own baseline.
Beta of 1.44x against the broader market means that on a typical market day, AVGO tends to move about 44% more than the index. In practical terms, if the S&P 500 drops 2% on a given day, AVGO might drop closer to 2.9%. That works in both directions.
The Value at Risk calculation says that in the worst 5% of trading days, AVGO can be expected to lose about 2.93% of its value. In the worst 1% of days, that figure climbs to 5.39%. For a stock currently trading near $447, that means potential single-day losses of $13 to $24 on bad days.
The Sharpe ratio of 0.82x suggests the stock’s risk-adjusted returns are acceptable but not exceptional. A Sharpe ratio above 1.0 would mean the stock is generating more than one unit of return per unit of risk. At 0.82x, you are getting slightly less than that, which is worth noting given how strong the absolute returns have been.
Volume over the recent 15 trading days averaged about 19.97 million shares daily, with the May 29 session seeing an unusually high 41.7 million shares as the stock hit $448.90. That kind of volume spike at a 52-week high can sometimes signal exhaustion buying rather than conviction accumulation.
AVGO Short Interest and Institutional Ownership Context
Two data points from the market structure side are worth incorporating into the technical picture.
Short interest of 1.15% of float is very low. Only about 53 million shares are held short, down from 55 million the prior month. There is no significant short squeeze potential here, which removes one potential catalyst for a rapid upward move. It also means that if the stock declines, there is limited buying pressure from short-covering to cushion the fall.
Institutional ownership of 80.16% tells you that professional money managers are broadly long this stock. The flip side is that heavy institutional ownership can sometimes lead to coordinated selling pressure when large funds rebalance or reduce positions, especially after a stock has run 86% in a year.
AVGO Technical Rating and What Each Type of Investor Should Do
The multi-factor technical rating for AVGO is Bullish, based on the combination of price trading above both major moving averages and the broader price trend direction. That is the honest summary of the longer-term technical picture.
But the shorter-term setup is messier. The MACD is negative. RSI is elevated. The stock is above its upper Bollinger Band. Volume on the recent breakout to 52-week highs was spiked rather than sustained. These are not reasons to sell a long-term position, but they are reasons not to chase the recent move with new money.
For long-term investors already holding AVGO, the technical picture does not justify selling. The stock is in a well-defined uptrend and the 200-day SMA at $352.30 remains the floor for that trend. The next several weeks may bring a consolidation or modest pullback, but the long-term structure is intact.
For short-term traders, a neutral stance makes more sense until there is a cleaner signal. Either a confirmed bounce off $425.52 with volume, or a decisive close above $440.68 with above-average buying activity, would provide a better risk-reward setup than buying at the current extended level.
For investors waiting to start a new position, the AVGO technical analysis suggests patience. A pullback to the $415.50 to $425.52 range would represent a better entry than chasing the stock near its all-time high. Given the upcoming June 3 earnings report, that opportunity may come sooner than expected. Earnings reactions at 52-week highs tend to be binary, and a slight miss or cautious guidance could bring prices back to those support levels quickly.
The one-year chart looks like a textbook uptrend. The 15-day chart looks like a stock that ran hard and fast and needs to breathe. Both readings can be true at the same time.
This article is for informational purposes only and does not constitute investment advice. All technical data and price levels referenced are based on publicly available market information as of June 1, 2026.