The company trades at a $2.1 trillion market cap heading into its June 3 earnings report. Here is what the numbers actually say.
Broadcom (AVGO) is one of those stocks that gets harder to analyze the more you look at it. The headline numbers are genuinely impressive. Revenue grew 29.5% year over year. Net income came in at $24.97 billion. The gross margin is 76.73%. By most traditional metrics, this is a financially healthy, profitable company.
But the stock is trading at 86.92x trailing earnings and 58.23x EV/EBITDA. You can find reasonable arguments for paying that kind of premium for a company growing at this pace, but you cannot pretend the valuation is cheap. So the real question heading into AVGO’s June 3 earnings is: what are you actually buying, and at what price does the math stop working?
AVGO Fundamentals: What the Business Actually Looks Like
Broadcom operates two main segments: Semiconductor Solutions and Infrastructure Software. The semiconductor side covers networking chips, custom silicon for AI infrastructure, Wi-Fi and Bluetooth connectivity, server storage solutions, and broadband access hardware. The infrastructure software side includes the VMware Cloud Foundation portfolio (acquired in late 2023), mainframe software, cybersecurity tools, and enterprise software products.
That combination matters for understanding the revenue profile. On June 1, 2026, Broadcom’s trailing twelve month revenue stands at $68.28 billion. A few years ago, that number was a fraction of what it is now. The VMware acquisition added roughly $20 billion in annual recurring software revenue, which explains a large chunk of the recent growth. AI-related custom silicon demand from hyperscalers like Google, Meta, and Apple has added another layer. These are not the same type of growth driver, and investors who treat them as interchangeable are making an analytical mistake.
The gross margin of 76.73% reflects the software mix. High-margin infrastructure software pulls the overall blended gross margin well above what a pure semiconductor company would generate. This is actually one of the more underappreciated aspects of the AVGO investment case: the business is structurally more profitable than it was three years ago, not just larger.
AVGO Fair Value Estimate: Reading Between the Lines
The fair value analysis based on four methodologies gives a blended estimate of $383.88, roughly 14.1% below the current price of $446.77.
That discount is not large enough to be alarming, but it is meaningful. Here is how the four inputs break down.
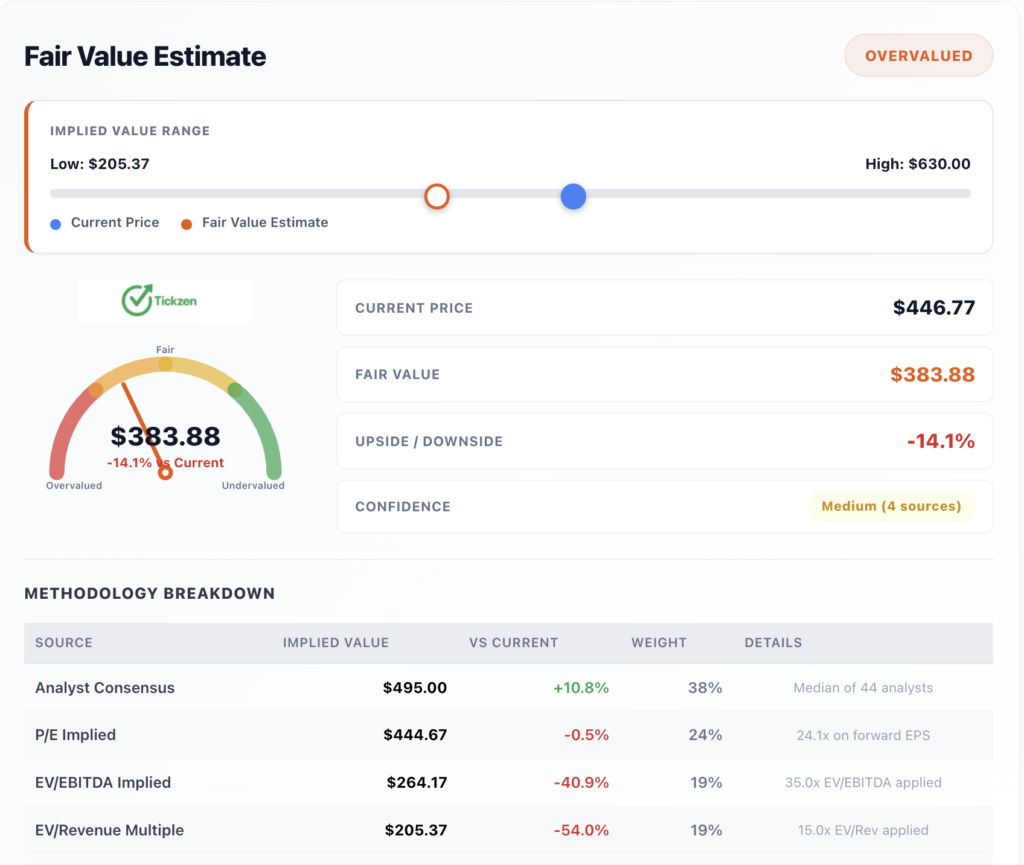
Analyst consensus puts implied value at $495.00, weighted at 38% of the blended estimate. The 44 analysts covering Broadcom have a mean price target of $481.97 and a median of $495.00, with the range running from $215.88 to $630.00. The spread on that range is wide enough to tell you that even professional analysts disagree significantly on what this business is worth.
The forward P/E method implies $444.67, just barely below the current price. This uses a 24.1x multiple applied to forward EPS, which feels reasonable given the forward P/E of 24.23x already embedded in consensus estimates.
Where the valuation gets uncomfortable is in the enterprise value multiples. Applying a 35x EV/EBITDA multiple implies $264.17 per share, a 40.9% discount to today’s price. The EV/Revenue method at 15x implies $205.37, a 54% discount. These are sector-normalized multiples, and the message is clear: by traditional enterprise value metrics, AVGO trades at a significant premium to what its revenue and EBITDA generation would justify at peer-average multiples.
The key question is whether Broadcom’s competitive position and growth trajectory justify that premium. The answer is probably yes, but only at a price.
AVGO Balance Sheet and Financial Health
Total debt of $66.06 billion is the number that warrants attention. Most of it came from financing the $61 billion VMware acquisition in 2023. Against that debt, the company holds $14.17 billion in cash, leaving net debt of roughly $51.89 billion.
The saving grace is cash generation. Operating cash flow over the trailing twelve months is $29.68 billion. Levered free cash flow is $25.50 billion. At that pace of cash generation, the company can service and reduce its debt load while still paying its $2.60 annual dividend and funding continued growth investment.
The current ratio of 1.90x and quick ratio of 1.67x confirm that near-term liquidity is not a concern. Return on equity of 33.37% and return on invested capital of 17.05% suggest the business is deploying capital effectively even at this scale.
The debt is not a crisis. But in a prolonged high-rate environment, $66 billion in debt creates a cost structure that leaves less room for earnings to disappoint.
AVGO Valuation vs Semiconductor Peers
The peer comparison is useful context. Broadcom’s 86.92x trailing P/E sits between Nvidia’s 32.38x and AMD’s 172.61x. That middle-ground position actually understates how differently these businesses are valued relative to their growth rates.
Nvidia grew revenue 85.2% year over year. Broadcom grew 29.5%. On a PEG basis, Broadcom’s 0.97x actually looks more reasonable than the headline P/E suggests. A PEG below 1.0 means you are paying less than 1x for each unit of earnings growth, which is a reasonable way to think about a company growing earnings at 31.6% annually.
The net margin comparison is also worth noting. Broadcom’s 36.57% net margin is well above AMD’s 13.37% and Intel’s negative 5.9%, though it trails Nvidia’s extraordinary 62.97%. Among large-cap semiconductor companies, Broadcom’s profitability profile is genuinely strong.
Institutional ownership of 80.16% and short interest of just 1.15% of float tell you that professional investors are not broadly skeptical of this business. When 80% of the float is held by institutions and fewer than 2% of shares are shorted, the bearish case is a minority view.
More From Tickzen:
- AAL Stock Before Earnings: Can the July 2026 Report Finally Close the $15 Gap to Fair Value
- American Airlines Stock (AAL) Technical Analysis 2026
- Is IREN Stock Overvalued at $61? What the Numbers Say Before You Buy
- EchoStar SATS Stock Analysis 2026: Is the 7x Rally Running Out of Steam?
- AVGO Technical Analysis: Is Broadcom Stock a Buy, Hold, or Trap Near Its 52-Week High?
What to Watch Heading Into AVGO Earnings on June 3
The June 3 report is the next major data point. The market will focus on a few specific items.
Custom AI silicon revenue from hyperscalers is the most watched line. Google and Meta have been large customers for Broadcom’s custom TPU and AI networking chips. Any commentary on the size and trajectory of these engagements will move the stock.
VMware integration progress matters too. The infrastructure software segment needs to show that Broadcom can maintain and grow the VMware customer base at the margins the company has targeted. If churn is higher than expected or the pricing transition is slower, that affects the growth thesis directly.
Revenue guidance for the fiscal third quarter will likely set the tone. The company reported $19.31 billion in revenue for fiscal Q1 2026, up 7.2% sequentially. The analyst consensus expects continued growth. Any guidance that comes in below expectations will pressure a stock that is already trading near its 52-week high of $448.90.
AVGO Dividend and Long Term Investment Case
The $2.60 annual dividend yields 0.58% at the current price. That yield is well below the five-year average of 1.87%, which reflects how much the stock price has risen over that period. The payout ratio of 47.17% means the dividend is well-covered by earnings and has room to grow.
For income-focused investors, 0.58% is not a compelling yield. For growth-and-income investors who want some downside cushion alongside capital appreciation potential, the sustainable payout plus strong free cash flow generation is a reasonable profile.
The analyst consensus of Strong Buy with a mean target of $481.97 implies about 7.9% upside from the current price. That is not a screaming buy signal at current levels, but it is also not a warning to sell.
Bottom Line on Broadcom Stock Valuation
Broadcom is a well-run business with durable competitive advantages in AI networking silicon and infrastructure software. The financials are strong, the cash flow is exceptional, and the growth rate justifies a premium valuation.
But at $446.77, the stock is priced for continued execution. The blended fair value estimate of $383.88 suggests modest overvaluation by traditional metrics, and the 58.23x EV/EBITDA multiple leaves little margin for error. A pullback toward the 50-day moving average at $385.70 would represent a materially better risk/reward entry for long-term investors.
The June 3 earnings report will either validate the current premium or put it under pressure. Given that the stock closed May 29 at its near-term high of $446.77, the bar for a positive reaction is already fairly high.
This article is for informational purposes only and does not constitute investment advice. All data sourced from publicly available financial information as of June 1, 2026.