The chip giant just posted a Q1 earnings beat. Its stock is up 311% over the past year. And Wall Street’s average price target is still 33% below where it’s trading. Something doesn’t add up — here’s what the data actually says.
Intel has had a strange few years. The company that once defined the semiconductor industry spent much of 2024 watching rivals eat its lunch, with INTC stock hitting a 52-week low of $18.97. Then, seemingly out of nowhere, things started moving. Fast.
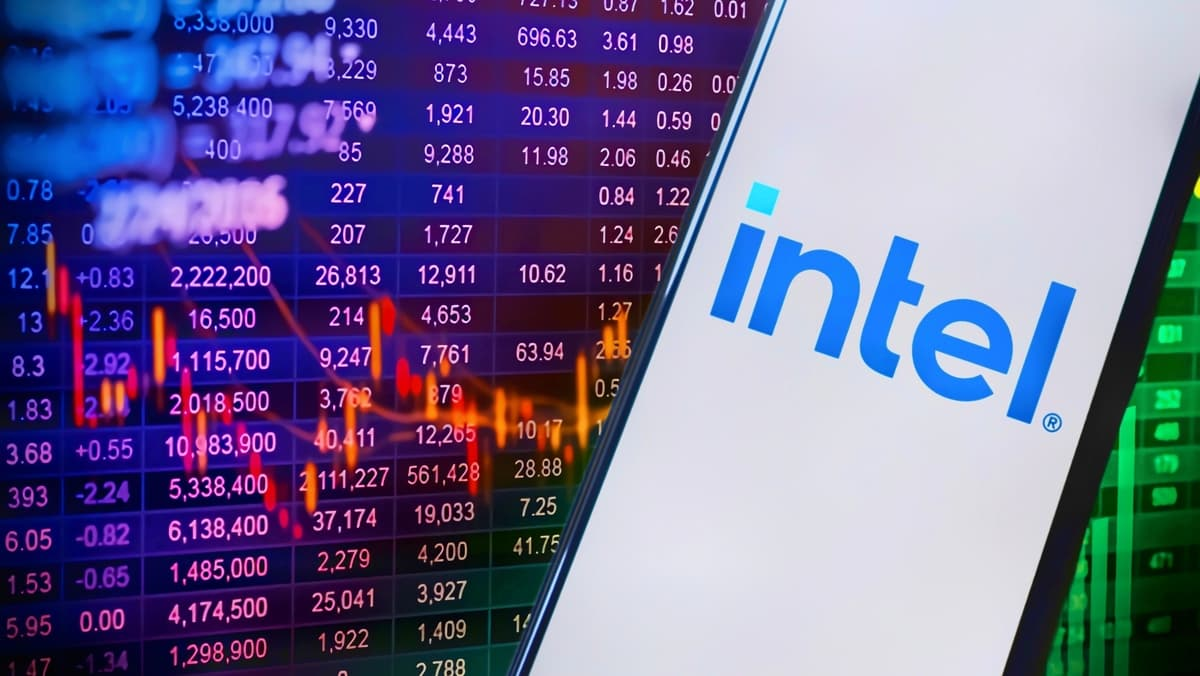
As of April 25, 2026, INTC stock is trading at $82.54 — near the top of its 52-week range of $18.97 to $85.22. In just the last 15 trading days, the stock gained +63.83%, driven partly by a better-than-expected Q1 earnings report and a strong Q2 outlook. The stock opened April 24 at $82.20 and hit an intraday high of $85.22 on volume of over 280 million shares.
So the obvious question: is this a genuine turnaround, or is the market getting ahead of itself?
Intel Stock Analysis 2026: The Bull Case in Plain English
Let’s start with what’s actually working before we get into the concerns — and there are real concerns.
Intel’s Q1 2026 revenue came in at $13.58 billion, down slightly quarter-over-quarter (-0.7%) but within a range that exceeded analyst expectations. The gross margin for the quarter hit 39.4%, a meaningful improvement, and the company offered a positive Q2 outlook that sent the stock surging. That’s the kind of catalyst that can shift institutional sentiment quickly.
The company operates across three segments: CCG (client computing), DCAI (data center and AI), and Intel Foundry. With 85,100 employees and revenue of $52.85 billion TTM, this is not a startup making promises — it’s a company with real infrastructure, real manufacturing, and a $414.85 billion market cap.
Institutional investors seem cautiously on board. Institutional ownership sits at 62.15%, and short interest is actually declining — from 120 million shares short in March to 119 million shares as of March 31, 2026. The short ratio (days to cover) is just 1.5x, meaning bears aren’t exactly piling in.
The stock is also trading above both its 50-day SMA ($51.03) and 200-day SMA ($38.45), which in trend-following terms is a clean bullish signal. Price is above both key moving averages. Momentum is with buyers, at least for now.
What the Fundamentals Actually Look Like
Here’s where it gets complicated.
Intel’s valuation metrics are stretched. The Forward P/E is 59.38x — which means you’re paying nearly 60 times expected earnings for a company that posted a net loss of $267 million TTM and carries a -0.51% net profit margin. Compare that to Micron (P/E 23.4x) or even NVDA (P/E 42.6x), and INTC’s multiple looks oddly rich for a company still in recovery mode.
The EV/EBITDA of 28.13x and Price/Sales of 7.85x tell a similar story. These aren’t value multiples. They’re growth multiples. The market is betting Intel’s turnaround will materialize — and betting heavily.
Return on equity? 0.02%. Return on invested capital? -0.17%. These numbers don’t suggest a company firing on all cylinders. The company has $47.11 billion in total debt against $37.42 billion in cash, giving it a net debt position of roughly $9.69 billion. The debt/equity ratio of 0.37x is relatively conservative compared to peers like NVDA (7.25x) and AMD (6.36x), but the interest burden matters when profitability is already thin.
Free cash flow is negative — levered FCF of -$4.50 billion TTM. The company generated $9.70 billion in operating cash flow, which shows the core business can produce cash, but heavy capital expenditure is eating into that.
Revenue declined 4.1% year-over-year. That’s the number that stands out most. While AMD grew revenue 34.1% and NVDA grew 73.2% over the same period, Intel went the other direction. In a world racing toward AI infrastructure, being the company with falling revenue is a problem.
Should I Buy Intel Stock Right Now? The DCF Reality Check
The discounted cash flow model tells a story worth taking seriously.
Using a 10-year, three-tier growth deceleration framework with a WACC of 11.7% and FCF margin expanding from roughly 0% in year one to 12% by year 10, the base case intrinsic value comes out to around $11 per share at the current WACC and terminal FCF margin assumptions.
The full sensitivity table drives the point home:
| WACC \ Terminal Margin | 8% | 10% | 12% | 14% | 16% |
|---|---|---|---|---|---|
| 9.7% | $9 | $12 | $15 | $18 | $20 |
| 10.7% | $8 | $10 | $13 | $15 | $17 |
| 11.7% | $7 | $9 | $11 | $13 | $15 |
| 12.7% | $6 | $7 | $9 | $11 | $13 |
| 13.7% | $5 | $6 | $8 | $10 | $11 |
At $82.54, you’re paying multiples of the modeled intrinsic value under almost every scenario shown. The base case implies a negative annual return of -18.5% per year if you buy today and Intel simply performs in line with expectations over the next decade. That’s not a typo.
This doesn’t mean the stock can’t keep going up. It’s clearly going up. But it does mean you’re paying for perfect execution, with zero margin for error.
Intel Stock Investment Risk: What Could Go Wrong
The risk analysis paints a picture worth understanding before committing capital.
The 30-day historical volatility (close-to-close) is 99.3% — nearly three times the full-history average of 36.3%. That level of volatility means the price can move dramatically in either direction. The beta of 1.35x confirms the stock moves 35% more than the broader market on average.
Value at Risk (5% confidence level) shows a potential single-day loss of -3.12% in the worst 5% of scenarios, while the maximum drawdown on record is -70.80%. The Altman Z-Score of 2.84x puts Intel in the “grey zone” — not distressed, but not firmly in the safe zone either.
The Sharpe ratio of 0.30x suggests risk-adjusted returns are relatively modest, and the Sortino ratio of 0.40x tells a similar story when you isolate downside volatility specifically.
There’s also the question of competition. NVDA and AMD have the AI momentum. AWS, Azure, and Google Cloud are building their own silicon. Intel Foundry is still fighting for credibility. These aren’t hypothetical risks — they’re ongoing battles.
What Wall Street Thinks: INTC Stock Analyst Price Target 2026
Wall Street’s consensus is “Hold” based on 41 analyst opinions. The mean price target is $55.33, which implies a -33% downside from the current price of $82.54. The high target is $95.00 and the low is $20.40 — a spread that reflects genuine disagreement about Intel’s trajectory.
The median target is $55.00. So the average professional analyst covering INTC thinks the stock is worth roughly $55, and it’s trading at $82. That’s a significant gap to explain away.
News sentiment is positive (0.19x score), partly driven by the Q1 earnings beat and the AMD upgrade from D.A. Davidson. Options sentiment is neutral (0.05x). The put/call ratio of 0.48x leans slightly bullish. The composite sentiment score is 0.07x — essentially flat neutral.
INTC vs. Peers: How Intel Stacks Up in Semiconductors
| Metric | AMD | NVDA | INTC | AVGO | MU |
|---|---|---|---|---|---|
| Market Cap | $567B | $5.06T | $414B | $2.00T | $560B |
| P/E Ratio | 133.3x | 42.6x | 59.4x | 82.6x | 23.4x |
| Revenue Growth | +34.1% | +73.2% | -4.1% | +29.5% | +196.3% |
| Net Margin | 12.5% | 55.6% | -0.5% | 36.6% | 41.5% |
| ROE | 7.1% | 101.5% | 0.02% | 33.4% | 39.8% |
| Debt/Equity | 6.4x | 7.3x | 0.37x | 0.83x | 0.15x |
Intel’s balance sheet is actually cleaner than most peers on a debt/equity basis. But every profitability and growth metric lags. NVDA’s 55.6% net margin versus Intel’s -0.5% is not a small gap — it’s a fundamental difference in business model maturity.
The next major catalyst is Intel’s earnings report on July 23, 2026. That will be the real test: can Intel grow into these multiples, or will the stock face a correction?
Intel Stock Price Prediction: The Bottom Line
The short version: Intel is a real company with real assets, a genuine turnaround story in progress, and a stock that has already run very, very far.
The +311.7% one-year return massively outperforms the S&P 500 (+29.7%) and NASDAQ (+40.5%). Year-to-date, INTC is up +109.6% against the S&P’s +4.5%. Those numbers are extraordinary — and they make new entry uncomfortable.
If you already own INTC, the long-term uptrend is intact as long as the stock holds above the 200-day SMA at $38.45. A pullback to the 50-day SMA ($51.03) would still represent a massive gain from the 52-week low.
If you’re thinking about buying now, the honest answer is that you’d be chasing a stock trading well above where 41 professional analysts think it should be, at valuations that assume a near-perfect recovery, with negative FCF and declining revenue. That’s a lot of risk layered on top of already elevated price.
The July earnings report will either validate the rally or expose it. Between now and then, the technicals say watch the 20-day SMA at $65.43. If INTC holds above it, bulls stay in control. If it breaks, a test of $64.26 or lower is on the table.
Intel hasn’t won the semiconductor race yet. The stock is just priced like it already has.
Analysis Source: Tickzen
All data sourced from Yahoo Finance via yfinance as of April 25, 2026. This article is for informational purposes only and does not constitute investment advice. Always conduct your own research and consult a qualified financial advisor before making investment decisions.