
There is a moment in every high-momentum stock where the chart starts telling a very different story than the headlines. AST SpaceMobile (ASTS) is at that exact moment right now. The stock closed at $105.86 on May 26, 2026 after gaining 54.70% in just 15 trading days. That kind of run gets attention. But attention and a good entry point are two very different things, and this article is about the difference.
If you are trying to understand where ASTS stock is headed technically, what the key support and resistance levels actually mean, and whether the current price represents a smart entry or a trap for latecomers, you are in the right place. I am going to walk through the technical picture the way I would explain it to someone sitting across the table from me.
ASTS Stock Technical Analysis 2026: The Trend Is Real But the Entry Is Risky
ASTS is trading above both its 50-day simple moving average of $84.20 and its 200-day simple moving average of $75.71. When a stock is above both of those levels, technicians call this a bullish alignment. The 50-day being above the 200-day confirms the intermediate trend is healthy. For long-term investors who want to buy and hold, that is genuinely good news.
But here is where it gets complicated. The current price of $105.86 is sitting 21.3% above the 20-day moving average at $87.24. That kind of extension from the mean is not where you want to be initiating a new position. Every time a stock stretches this far above its short-term average, the probability of a pullback increases. The market has a gravitational pull back toward averages, and the further a stock moves from them, the harder that pull becomes.
This does not mean ASTS is about to collapse. It means new buyers are taking on more risk than the chart suggests at first glance.
ASTS RSI and MACD Signal Analysis: Momentum Is Strong But Getting Stretched
The RSI on ASTS is currently sitting at 67.9. That number tells an interesting story on its own. On one hand it is not yet in overbought territory which is typically defined as above 70. On the other hand, anything above 65 in a stock this volatile starts to indicate that the easy momentum has already been captured.

In very strong trends, the RSI can stay elevated for extended periods. ASTS could absolutely keep running with an RSI in the 65 to 75 range. But the risk/reward for new entries at these RSI levels becomes less favorable. The people who bought when RSI was in the 40s and 50s are sitting on significant gains. The people buying now are relying on the trend continuing at the same velocity.
The MACD tells a more encouraging short-term story. The histogram is positive at 3.64, which confirms upward momentum has not broken down yet. When the MACD histogram is positive and expanding, it typically means the bulls are still in control. But volume is worth watching here because the recent run has come on trading volume near its recent average, not on a surge. That is a neutral signal. Breakouts and continuation moves tend to be more reliable when volume accelerates alongside price.
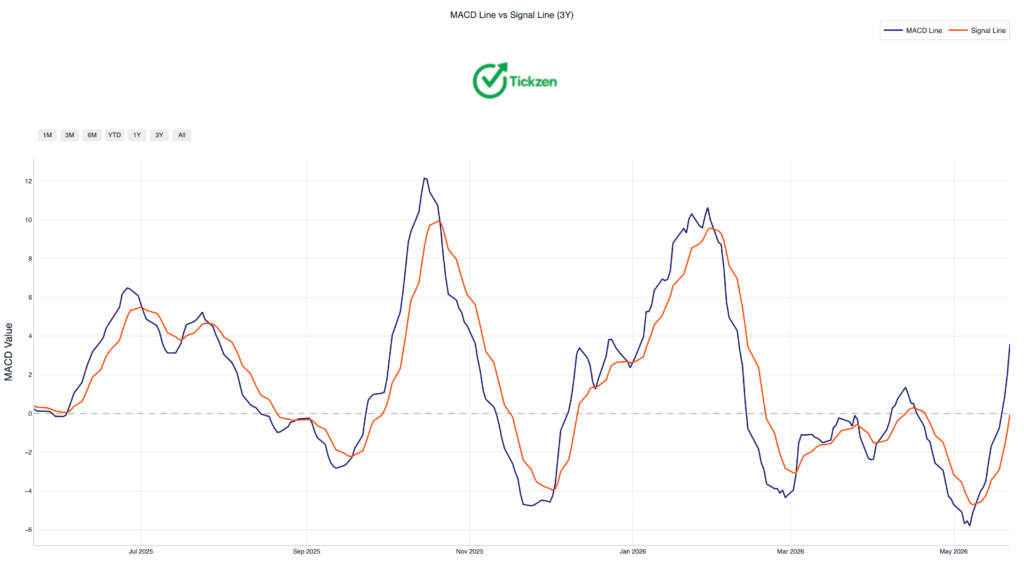
The combined read from RSI and MACD is this: momentum is intact but the setup is extended. Experienced traders wait for pullbacks to support before adding exposure at these levels.
ASTS Stock Support and Resistance Levels: Where the Price Is Most Likely to React
This is where technical analysis becomes genuinely useful for planning an actual trade, not just describing what already happened.
The most important short-term level to watch is $87.24 which is the 20-day moving average. As long as ASTS holds above this level on a closing basis, the short-term uptrend remains intact. A close below it would be the first signal that momentum is fading and a deeper retracement is underway.
Below that, the 50-day SMA at $84.20 represents the next meaningful support zone. A dip to this area during a healthy bull trend is completely normal and would likely attract buyers who missed the initial run.
There is also a well-tested cluster support zone around $69.82 which has been tested six times previously. When a price level holds that many times it becomes structural support. A breakdown below that level would be a genuine bearish signal and would open a retest of the 200-day moving average at $75.71.
On the upside, the Bollinger Band upper boundary is currently at $100.13. The stock is already trading above this level, which is called walking the band. When price sustains itself above the upper Bollinger Band it can confirm a powerful trend. But it also means any stall in momentum will likely result in a snap back toward the middle band.
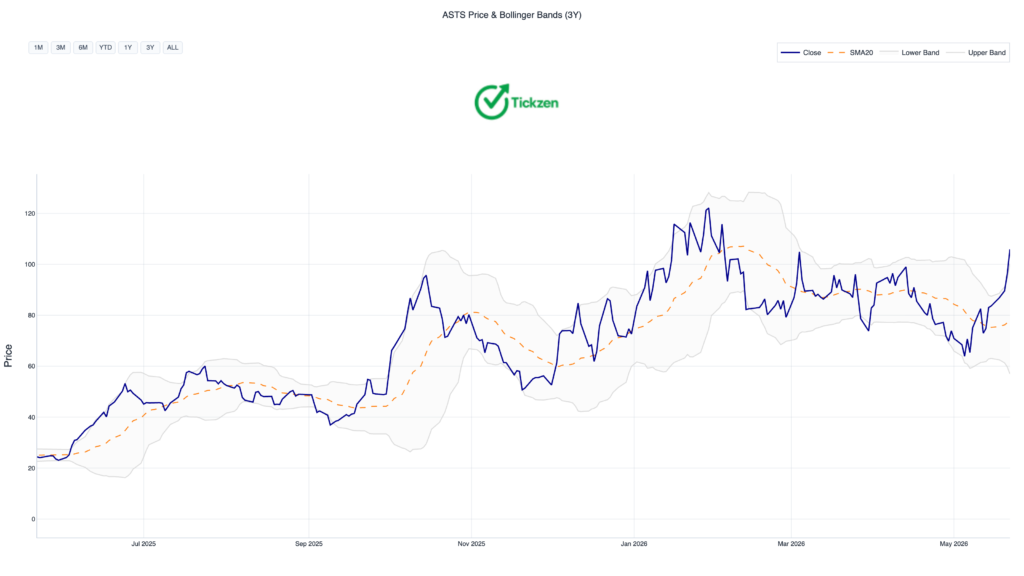
The 52-week high of $129.89 is the next major technical resistance level for anyone thinking about the full potential move if the trend continues.
ASTS Short Interest and Its Impact on Price Action
One of the most underappreciated parts of the ASTS technical picture right now is the short interest data. There are currently 54 million shares sold short, representing 18.14% of the float. That figure increased from 46 million shares the prior month.
A rising short interest as a stock is going up tells you that a meaningful group of sophisticated investors are betting against it even as it rallies. The short ratio is 3.2 days to cover. That is not an extreme reading but it is high enough that any significant positive catalyst could cause a short squeeze where shorts rush to cover, adding fuel to an already moving stock.
The put to call ratio on ASTS options is sitting at 0.23, which leans heavily toward calls. Options traders are more bullish than bearish overall. The nearest expiry implied move is approximately 27% in either direction by the June 26 expiration. That is an enormous implied range and it reflects just how much uncertainty exists around where this stock is headed in the near term.
More From Tickzen:
- Delta Air Lines Stock Analysis 2026: Is DAL Stock a Good Investment Right Now?
- Is IREN Stock Overvalued at $61? What the Numbers Say Before You Buy
- EchoStar SATS Stock Analysis 2026: Is the 7x Rally Running Out of Steam?
- Nokia Stock Technical Analysis 2026: Is NOK Overbought or Setting Up for the Next Big Move?
- Why Is APLD Stock Up Today 21, May, 2026?
ASTS Stock Volatility: What a Beta of 2.60 Actually Means for Your Portfolio
I want to spend a moment on volatility because this is where a lot of retail investors get hurt with a stock like ASTS without fully understanding what they are holding.
The beta is 2.60. What that means in practical terms is that if the S&P 500 drops 10%, ASTS is likely to drop approximately 26% just from the market decline alone, before accounting for any company specific news. The 30-day historical volatility is 114.6%, which is roughly five times higher than what you would expect from a typical large-cap stock.
The maximum drawdown in ASTS history is 91.07%. If you had bought at a peak and held through the worst decline this stock ever experienced, you would have watched your position lose nine-tenths of its value. That is not a hypothetical risk. That is documented history.
None of this makes ASTS uninvestable. It makes it a stock that requires clear position sizing, defined stop levels, and genuine honesty about your own risk tolerance before putting money in.
ASTS Technical Trading Plan: What to Do Now
For short-term traders, the honest answer is that the current setup favors waiting over chasing. The trend is intact but the extension from the mean is significant, the RSI is elevated, and volume has not confirmed the recent leg higher with conviction. A pullback to the $87.24 area with stabilization would represent a much better risk/reward entry than the current price.
For long-term investors who believe in the fundamental story, the technical picture actually supports a patient approach. The 200-day SMA at $75.71 represents the line in the sand for the secular uptrend. As long as price holds above that level on monthly closes, the broader trend is intact. A pullback toward the 50-day SMA at $84.20 would offer a more comfortable entry than buying into a 54% rally.
The next major catalyst is the earnings report on August 10, 2026. Whatever happens between now and then will likely set up the technical picture for the second half of the year.
My honest read: the chart is bullish but stretched. The trade for new buyers is not today. It is after the next meaningful pullback to support, with confirmation that buyers step back in. Patience here is not a passive strategy. It is the active choice that protects your capital while keeping you positioned for the bigger move.
This article is for informational and educational purposes only. It does not constitute financial or investment advice. Always conduct your own research and consult a qualified financial advisor before making any investment decisions.