Valuing a company that loses money is one of the oldest debates in investing. Do you look at what it earns today or what it could earn in five years? AST SpaceMobile forces you to take a side in that debate right now because at a market cap of $31.63 billion with only $84.94 million in annual revenue, you are paying almost entirely for the future.
I have spent years analyzing early-stage growth companies before they hit profitability, and ASTS is one of the more genuinely interesting cases I have looked at in recent memory. Not because the financials are good right now. They are not. But because the technology is real, the carrier partnerships are confirmed, and the regulatory approval has been received. The question is whether the stock at $105.86 already prices all of that in.
AST SpaceMobile Business Model and Revenue Growth: The Case for Believing
Start with the business because the numbers only make sense once you understand what the company is actually building.
AST SpaceMobile is developing a constellation of BlueBird satellites that allow regular smartphones to connect directly to a cellular broadband network from space. No special equipment. No satellite phone. Your existing device connects to their network when you are outside normal terrestrial cell coverage.
This is not vaporware. The company has received FCC approval for direct-to-device satellite services. It has signed commercial contracts and formed a joint venture with AT&T, Verizon, and T-Mobile. Three of the largest telecom companies in the United States have committed to this technology. That is not small validation.
The revenue growth number reflects the early stage of actual commercial activity. Year-over-year revenue growth came in at 1,952.20%. That is the kind of number that stops you mid-sentence. Revenue went from essentially nothing to $84.94 million on a trailing twelve-month basis. The most recent quarter saw a 72.2% sequential revenue decline which suggests lumpy contract timing rather than a structural problem, but it is worth monitoring going forward.
The gross margin sits at 44.82%, which is actually healthy for a capital-intensive hardware and satellite business. That tells you the underlying unit economics are not broken. When revenue scales to match the infrastructure already being built, those gross margins could power meaningful profitability.
ASTS Valuation Analysis: Why the Numbers Look Absurd and Why That Might Be the Point
Let me give you the valuation numbers straight and then explain how to think about them.
The stock trades at 483.74 times revenue. The enterprise value to revenue ratio is 378.74 times. The forward price to earnings ratio is negative 356.28 times, which reflects the fact that analysts expect continued losses ahead. There is no meaningful price to free cash flow ratio because free cash flow is deeply negative at negative $1.41 billion on a levered basis.
By every conventional valuation metric, ASTS looks wildly overvalued today.
But here is the context that matters. Amazon traded at absurd revenue multiples throughout the late 1990s and early 2000s while it was building logistics infrastructure. The market was not paying for what Amazon earned then. It was paying for what the infrastructure would generate once the network was complete. ASTS is in a similar infrastructure build phase. The satellite constellation is the infrastructure and it is not yet fully deployed.
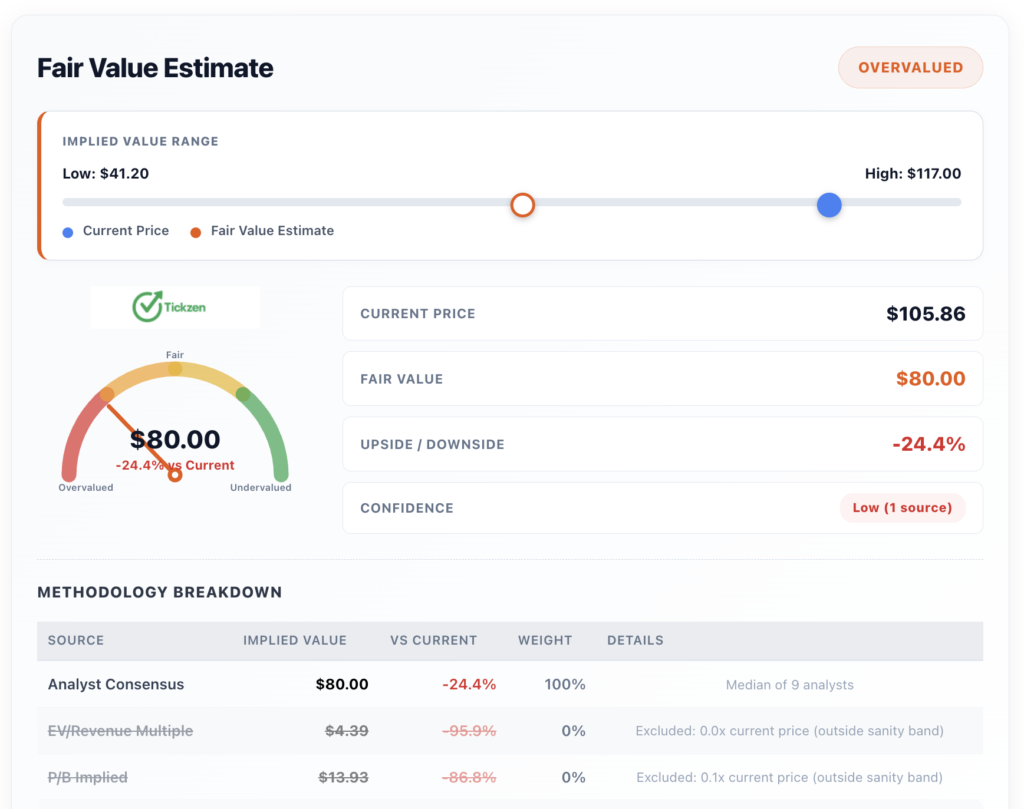
The fair value estimate from the median of nine analyst opinions is $80.00, implying the stock is currently 24.4% above where professional analysts think it should trade. The range of analyst targets runs from $41.20 on the low end to $117.00 on the high end. That is an enormous spread and it tells you that even professionals with full access to management cannot agree on what this company is worth.
Analyst consensus is Hold. When analysts say Hold on a stock already above their price target, they are usually saying they believe in the long-term story but they are not comfortable recommending you buy at the current price.
More From Tickzen:
- Is IREN Stock Overvalued at $61? What the Numbers Say Before You Buy
- ASTS Stock Technical Analysis 2026: What the Charts Are Really Telling You Before the Next Big Move
- EchoStar SATS Stock Analysis 2026: Is the 7x Rally Running Out of Steam?
- Nokia Stock Technical Analysis 2026: Is NOK Overbought or Setting Up for the Next Big Move?
- Why Is APLD Stock Up Today 21, May, 2026?
ASTS Financial Health Analysis: What the Balance Sheet Actually Shows
ASTS has $3.03 billion in cash against $2.99 billion in total debt. Those are almost identical numbers, which means the net cash position is approximately $40 million. The debt-to-equity ratio is 1.12 times, which is manageable. The company is not about to run out of money.
The current ratio of 18.47 times and quick ratio of 17.91 times show that the company can easily cover its short-term liabilities. For a company at this stage of growth, that liquidity cushion matters enormously. It gives management the ability to execute without being forced into dilutive capital raises at bad prices.
Operating cash flow is negative $91.03 million on a trailing twelve-month basis. That sounds alarming but for a company spending heavily to deploy satellites and build out infrastructure, some negative operating cash flow is expected. The number to watch more carefully is the Altman Z-Score which sits at 5.08. Anything above 3.0 is considered the safe zone for bankruptcy risk. ASTS scores well here.
The return on equity is negative 37.75% and the return on assets is negative 6.30%. Those are objectively poor numbers. But they reflect the current moment in the company’s lifecycle, not the steady state. A satellite network that earns nothing while being built will have terrible returns until it starts generating consistent revenue.
Net income is negative $487.25 million on a trailing twelve-month basis. EBITDA is negative $316.39 million. These are large losses in absolute terms and investors need to be honest with themselves about that.
ASTS Insider Trading Activity and What It Means for Long-Term Investors
Over the last three months, insiders filed 21 transactions. Of those, 14 were sales and 7 were purchases. Focusing only on open market discretionary activity, there were 5 open market sales and zero open market purchases.
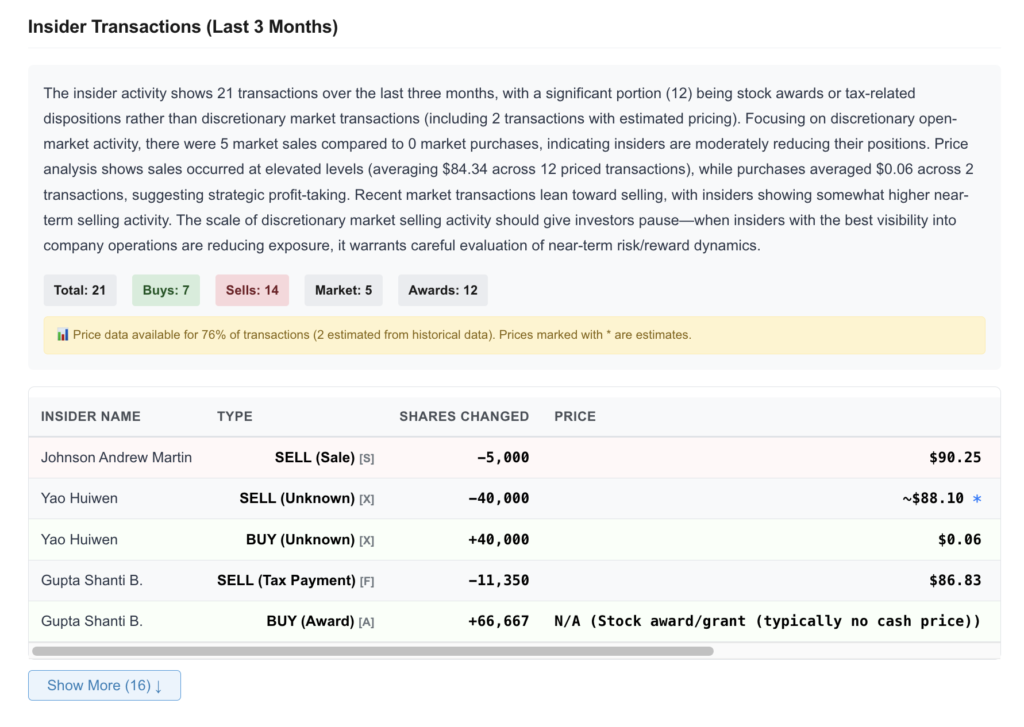
Sales occurred at an average price of around $84.34. The stock is now at $105.86. That means insiders were selling at prices well below where the stock is trading today, which is not necessarily as alarming as it first sounds. Some of those sales were tax-related dispositions tied to stock awards rather than deliberate decisions to reduce conviction.
But five open market sales and zero open market purchases is still a fact worth sitting with. The people who know the company best are not using their own money to buy the stock right now. That does not mean they think it is going down. It could mean they are diversifying perfectly normal gains. But it is not the kind of insider activity that gives you additional confidence as an outside investor.
AST SpaceMobile vs Competitors: How Does ASTS Compare to Peers
The peer comparison shows how different ASTS is from everything else in the communications equipment space.
Iridium (IRDM) has a market cap of $5.16 billion, earns a 12.05% net margin, and pays a 1.23% dividend yield. It is a profitable, cash-generating satellite business. Its revenue growth is only 1.90% per year. Globalstar (GSAT) has a market cap of $10.69 billion and a forward PE of 271 times, also trading at premium multiples while losing money.
ASTS at $31.63 billion is larger than all of them combined, except possibly when you include Lumen. It is making a bet that the total addressable market for direct-to-device satellite connectivity is dramatically larger than anything existing satellite companies have accessed so far. That market thesis is not unreasonable. If every smartphone on earth becomes a potential customer, the numbers do become very large.
But ASTS has to actually capture that market, and doing so will require execution against a capital-intensive roadmap while managing competition from well-capitalized players including SpaceX Starlink and others entering the space.
Is ASTS Stock a Good Long-Term Investment Right Now?
Here is where I give you my honest take as someone who has looked at this data carefully.
The fundamental story at AST SpaceMobile is genuinely compelling. The technology is real. The partnerships with major carriers are real. The FCC approval is real. The 1,952% year-over-year revenue growth, however lumpy, shows that actual commercial activity has begun.
The problem is the price. At $105.86 with a median analyst fair value of $80.00 and a gross margin that has not yet translated into operating profitability, the stock is asking you to pay full price for an outcome that is not yet guaranteed. The August 10, 2026 earnings report will be the next major test of whether the revenue trajectory can justify the valuation.
For long-term investors with a five-year horizon and genuine comfort holding through a potential 50% or greater drawdown, the ASTS story is worth serious attention. The 52-week range of $22.47 to $129.89 shows this stock is capable of very large moves in both directions.
For anyone who would panic at a 30% correction or needs this money within two years, the current risk profile is not a fit regardless of how exciting the technology is.
The most sensible approach is a small position size relative to your total portfolio, full awareness that this is a speculative growth bet rather than a value investment, and a clear plan for what you will do if the stock revisits the $70 to $75 range. If you do not have an answer to that last question before you buy, that is the answer.
This article is for informational and educational purposes only. It does not constitute financial or investment advice. All data sourced from publicly available financial reports as of May 26, 2026. Always conduct your own research and consult a qualified financial advisor before making investment decisions.