Most articles about Apple stock right now fall into two camps. One camp says it is the greatest company ever built and you should buy as much as you can afford. The other says it is overvalued and the rally is about to end. Neither of those is particularly useful if you are trying to make a real decision.
Let me give you a ground-level look at what the data says about where Apple stock is headed, what the risks are, and how to think about it if you hold it or are considering buying.
Apple Stock Price Today and What the Charts Show
Apple closed at $297.84 on May 19, 2026, up 44.4% over the past year. The 52-week range has been $193.46 on the low end and $303.20 on the high end. The stock is currently sitting near the top of that range.
The two moving averages that matter most in technical analysis are the 50-day, which sits at $267, and the 200-day, which is at $259.58. Both are below the current price, which means the trend is up. A golden cross, where the 50-day moves above the 200-day, is considered a bullish long-term signal, and that pattern is present here.
The MACD reading is positive at 1.37, supporting short-term upward momentum. But the RSI at 71.7 is the one number that should give new buyers pause. When RSI crosses above 70, it does not guarantee a sell-off, but it historically increases the chance of a short-term pullback before the next move higher. Buying into a reading this elevated usually means accepting a worse average cost.
The Bollinger Band setup shows the stock trading in the upper half of its bands, between the 20-day moving average and the upper band. That is technically healthy. The 20-day SMA at $290.29 is immediate support. A clean close below that level would shift the short-term picture.
Apple Revenue Growth, Margins, and Earnings: The Numbers That Matter
The fundamental story for Apple in 2026 is better than most people expected a year ago.
Revenue for the trailing twelve months was $451.44 billion, with 16.6% growth year-over-year. That is faster than what most analysts were modeling at the start of 2025. Net income came in at $122.58 billion, and earnings growth year-over-year was 21.8%.
Gross margin is 47.86%. For a company with Apple’s scale in hardware, that is exceptional and is largely driven by the services segment, where margins run significantly higher than on physical products. Operating margin of 32.27% and net profit margin of 27.15% confirm that most of the revenue Apple generates translates into real earnings.
The most recent quarter showed $111.18 billion in revenue and $29.58 billion in net income. Diluted EPS came in at $2.01. Revenue was down 22.7% from the prior quarter, but that comparison is against the December quarter, which is always the strongest due to holiday iPhone demand. Year-over-year, the growth picture was solid.
Free cash flow for the trailing twelve months was $101.09 billion. Operating cash flow was $140.22 billion. These are numbers that most companies would never see in their lifetimes. Apple generates more cash in a year than many countries’ GDP.
Apple Fair Value Estimate 2026: Is the Stock Overvalued?
This is the uncomfortable part of the analysis.
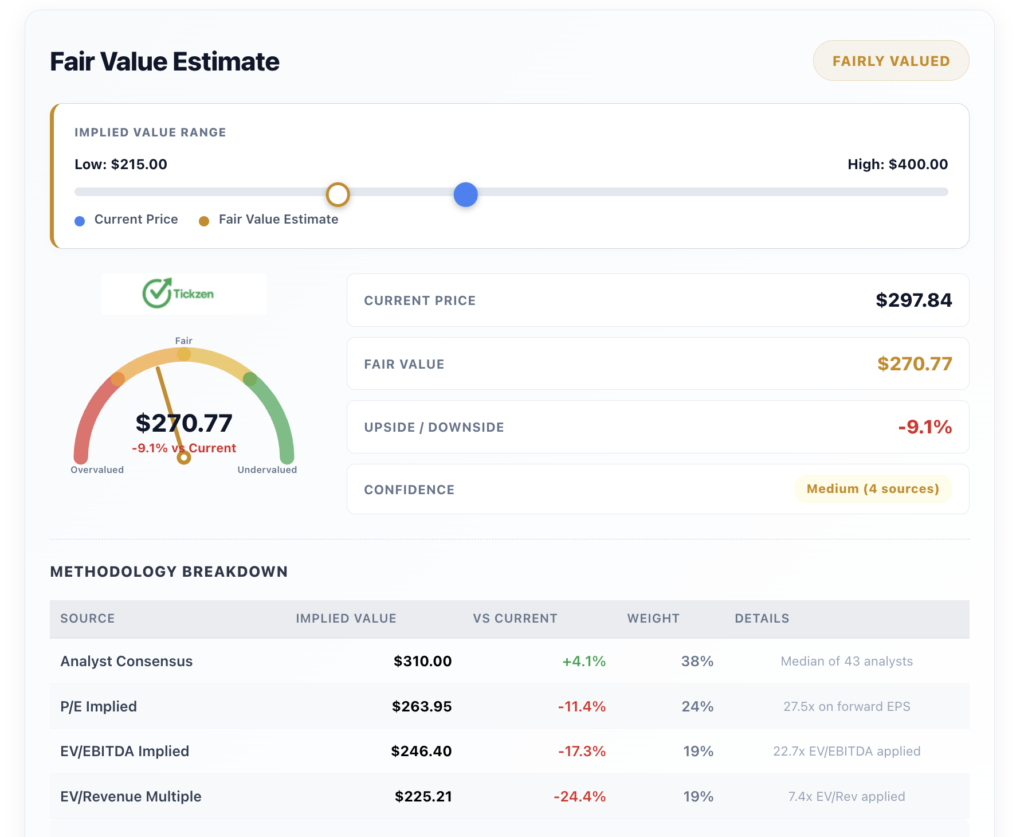
Using a blend of four valuation approaches, analyst consensus, P/E implied value, EV/EBITDA, and EV/Revenue, the weighted fair value estimate comes out to $270.77. At the current price of $297.84, the stock is trading roughly 9.1% above that estimate.
The analyst consensus target is $308.07, with a median from 43 analysts. Specific targets include $400 from Wedbush, $375 from Tigress Financial, and $365 from Evercore ISI. Those are the bulls. The more conservative models using earnings multiples and revenue multiples point to values closer to $225 to $264.
The trailing P/E is 36.1x and the forward P/E is 31.07x. The PEG ratio at 2.61x reflects a premium for expected growth. EV/EBITDA of 27.45x and EV/Revenue of 9.73x are both at the higher end of where large-cap tech companies typically trade.
None of this means the stock is going to fall. Overvalued stocks can stay overvalued for years if the business keeps growing. But it does mean the margin of safety is thin. If Apple misses earnings in July, the stock will reprice quickly.
More From Tickzen:
- Delta Air Lines Stock Analysis 2026: Is DAL Stock a Good Investment Right Now?
- Micron Technology Stock in 2026: Is MU Stock a Good Buy Right Now?
- Is IREN Stock Overvalued at $61? What the Numbers Say Before You Buy
- EchoStar SATS Stock Analysis 2026: Is the 7x Rally Running Out of Steam?
- MRAM Stock Up 172% in 15 Days — Is Everspin Technologies Still Worth Buying?
Apple Services Business and Long-Term Growth Drivers
The hardware cycle is real, and it is slowing. Smartphone upgrade rates are lower than they were five years ago. That is a structural issue for iPhone revenue.
What Apple has done in response is build a services ecosystem that most of its 2 billion active device users interact with regularly. The App Store, Apple Music, Apple TV, iCloud, Apple Pay, Apple Arcade, and Apple Fitness+ together generate recurring subscription revenue that does not depend on anyone buying a new device.
Services revenue carries margins that are significantly higher than hardware. When the mix shifts toward services, overall company margins improve even if iPhone unit sales plateau. That is exactly what has been happening, and it is the core reason Apple’s valuation has stayed elevated despite questions about hardware growth.
The announced AI features coming in iOS 27, including new writing tools and improved Siri shortcuts, are the next catalyst the market is watching. Apple has been seen as behind competitors in generative AI. If iOS 27 delivers something compelling, it could shorten upgrade cycles and drive another round of iPhone replacements.
Apple Stock Risks in 2026 That Investors Underestimate
China is the biggest single risk. Apple generates a substantial portion of its revenue from China, and the geopolitical situation between the U.S. and China has not stabilized. Tariffs, trade restrictions, or a government preference for domestic brands over Apple in the Chinese market would create real earnings pressure.
The supply chain is also concentrated in ways that are hard to diversify quickly. Manufacturing in China and Taiwan means Apple carries geopolitical exposure that cannot be hedged perfectly. The company has been working to shift production toward India and Vietnam, but that transition takes years.
On the technical side, 30-day historical volatility is 23.3% and the maximum drawdown on record is 38.52%. If the broader market enters a correction, Apple will not be immune. A beta of 1.06x means Apple moves roughly in line with the S&P 500, so broad market risk is fully present.
Short interest is low at 0.92% of the float, with 135 million shares short. That number increased from 127 million in the prior month. It is a small shift, but it is worth noting. The bears who are in this trade have been getting squeezed, but more are starting to position.
What Analysts Say About AAPL Heading Into the Next Earnings
The analyst consensus is Buy with a mean target of $308.07. Out of 32 analyst ratings tracked, 30 are bullish and 2 are bearish. The sentiment score from the broader data is 70 out of 100, which reflects cautious optimism rather than euphoria.
Institutional ownership is 65.74%, with Blackrock, Vanguard, and State Street as the top three holders collectively representing about 18.4% of shares. Vanguard increased its position by 1% recently, which is a meaningful move at that scale. Blackrock trimmed slightly. Net institutional flow is running positive.
Insider activity tells a different story. 72 buy transactions against 18 sell transactions sounds bullish on the surface, but the dollar value of the sells is notable. Arthur Levinson, a board member, sold $71.19 million and $45.46 million in separate transactions. Insider selling does not always signal a problem, but at these volumes, it is worth tracking.
Apple Stock Price Prediction 2026 to 2027: What to Expect
No model predicts stock prices with precision, and anyone who tells you otherwise is selling something. What the data can tell you is the probable range of outcomes.
The upside case: Apple delivers strong iOS 27 adoption, services revenue continues growing above 15% annually, and the July earnings beat leads analysts to raise targets. In this scenario, the $350 to $400 range becomes achievable over the next 12 months.
The base case: growth moderates slightly, the stock consolidates between $265 and $310, and the forward P/E compresses gradually from 31x toward 27x as earnings catch up with the price. This is the most likely outcome.
The downside case: China revenue deteriorates from tariffs or regulatory pressure, iPhone upgrade cycles disappoint, and the market re-rates the stock toward a 22x to 24x forward multiple. That would put the stock in the $210 to $240 range.
Investors holding Apple long-term through all three scenarios have historically come out well. The real question is whether you can tolerate the downside case emotionally and financially if it materializes.
Apple is not a broken story. The financials are strong, the services business is growing, and the brand has pricing power that almost no other consumer technology company can match. But at $297.84, you are not getting a bargain. You are paying up for quality and trusting that the growth continues.
For long-term investors, that has been the right call for most of the past decade. Whether the next twelve months extend that run or deliver a pause depends largely on how the AI and China situations develop.
The next real test is the earnings report on July 30, 2026.
This article is for informational purposes only and does not constitute investment advice. Always conduct your own due diligence before making investment decisions.