Intel’s market cap crossed $567 billion in May 2026. Twelve months earlier, the stock was trading near $20. That is not a recovery. That is a complete reassessment of what this business is worth, and it happened faster than almost any institutional model predicted.
Before you decide whether to buy, hold, or sell INTC right now, you need to understand what price prediction models are actually pricing in, what the Intel Foundry business turnaround must deliver, and where the INTC stock forecast 2026 assumptions could break down.
INTC Stock Forecast 2026: What the Current Price Actually Assumes
The current INTC stock price of $113.01 implies a forward price-to-earnings ratio of 74.53x. That multiple exists on a company currently losing money. Net income for the trailing twelve months is negative $3.17 billion on revenue of $53.76 billion, producing a net margin of negative 5.9%. The market is not paying for what Intel earns today. It is paying for what Intel is expected to earn in 2027 and beyond.
The Intel Q1 2026 earnings results showed revenue of $13.58 billion, which was a 7.2% improvement year over year but a 0.7% decline from Q4 2025. Gross margin came in at 39.4%, which is the most constructive number in the Intel Q1 2026 earnings report. Gross margin recovery is the first sign that the Intel Foundry business turnaround is improving product economics. The problem is that high operating expenses and capital costs consumed all of that gross profit, producing a Q1 net loss of $3.73 billion.
For the INTC stock forecast 2026 to hold at this valuation, the next two earnings reports need to show DCAI revenue acceleration and a clear path toward operating margin expansion above the current 6.88% TTM level. Analysts have a consensus target of $79.05 with a median of $80.00, based on 42 analyst opinions. The INTC analyst rating buy hold sell consensus is Hold. That is 30.1% below the current trading price.
More From Tickzen:
- NBIS Stock Analysis 2026: Is Nebius Group Worth Buying After a 508% Run?
- Micron Technology Stock in 2026: Is MU Stock a Good Buy Right Now?
- MU Stock Technical Analysis 2026: Is Micron Overbought or Breaking Out?
- QUALCOMM Stock Price Prediction 2026: Technical Analysis, & Key Levels
- INTC Stock Surge 2026: How the Intel Apple Chip Deal Changed Wall Street’s View
Intel Stock Price Prediction 2027: The Foundry and AI Thesis Must Execute Together
The Intel stock price prediction 2027 from the bull camp rests on two concurrent developments: the Intel 18A process node achieving commercial-scale yield rates that attract external foundry customers, and the DCAI segment converting AI inference demand into revenue growth above the semiconductor industry average.
Intel 18A is the most advanced node Intel has ever manufactured. It incorporates RibbonFET transistor architecture and PowerVia backside power delivery. The Intel Apple chip deal confirmed that 18A is production-ready enough for a customer like Apple to commit volume. If Intel 18A process node yield rates continue improving through 2026, the foundry economics change materially in 2027 when depreciation pressure on early process development begins to ease.
Intel semiconductor AI chips demand is the other variable. AI inference workloads, unlike GPU training, run on a wider variety of hardware architectures. Intel’s Gaudi AI accelerators and its latest Xeon processors with integrated AI acceleration are positioned for inference deployments in enterprise data centers and edge environments. Intel semiconductor AI chips demand growth does not require Intel to beat Nvidia at GPU training. It requires Intel to capture a measurable share of inference workloads, which the DCAI segment is actively pursuing through the Intel Google Cloud partnership and other hyperscaler relationships.
The Intel stock price prediction 2027 at current analyst consensus implies modest upside from the $79 to $80 target range if execution is on schedule. A meaningful beat of that execution timeline, particularly on foundry customer additions and DCAI revenue growth, could push the forward multiple higher. The $118 high analyst target reflects that scenario.
Intel Stock Price Prediction 2030: The Long-Duration Case
The Intel stock price prediction 2030 is where the foundry strategy either works or it does not. By 2030, Intel will have spent several hundred billion dollars in cumulative capital expenditure across its fab network. The US government Intel stake and the Intel Fab 34 Ireland Apollo buyback structure provide partial capital relief, but the core bet remains: Intel becomes a viable alternative to TSMC for advanced node manufacturing by the end of this decade.
The DCF model paints a challenging picture at the current price. Using a 16.2% weighted average cost of capital (reflecting Intel’s beta of 2.19 and a size premium), a base case FCF margin expansion from near zero to 12% over ten years, the base case intrinsic value comes in well below $113. The model implies a negative annual return of 26.5% per year from the current entry price if base case assumptions play out. Even at a 14.2% WACC with a 16% terminal FCF margin, intrinsic value reaches approximately $10.01 per share. On that basis alone, Intel stock overvalued or undervalued is a question the DCF model answers clearly: overvalued at $113 by a wide margin under almost any reasonable discount rate assumption.
The Intel stock price prediction 2030 at $113 entry only works if the bull case materializes: above-consensus foundry revenue, sustained AI chip market share gains, operating leverage from fixed costs over a larger revenue base, and no major competitive or geopolitical disruption to the semiconductor supply chain.
Is Intel a good buy in 2026 for a 2030 horizon? The thesis is coherent. The execution path is plausible. The price is not forgiving.
INTC vs AMD vs Nvidia 2026: Where Intel Actually Stands
The INTC vs AMD vs Nvidia 2026 comparison is sharper than most headlines suggest.
Nvidia’s net margin is 55.6% on revenue growing 73.2% year over year. Its ROE is 101.48%. AMD’s revenue is growing 37.8% with a net margin of 13.4% and an ROE of 8.06%. Intel’s revenue is growing 7.2% with a net margin of negative 5.9% and an ROE of negative 2.91%.
Intel market cap 2026 at $567.99 billion is the second smallest in the peer group, below MU’s $751.74 billion, AMD’s $687.12 billion, Broadcom’s $2.01 trillion, and Nvidia’s $5.05 trillion. On a forward P/E basis, Intel at 74.53x is actually cheaper than AMD at 140.93x and Broadcom at 82.61x, though Nvidia at 42.41x trades at a discount to all of them on earnings quality.
In the INTC vs AMD vs Nvidia 2026 comparison, the most relevant distinction is debt and balance sheet structure. Intel carries a debt-to-equity ratio of 0.36x, which is far more conservative than AMD at 6.0x or Nvidia at 7.25x. Intel’s current ratio of 2.31x and quick ratio of 1.66x show solid short-term liquidity. Intel market cap 2026 at $568 billion is a significant sum for a company still working through a fundamental business transition.
Where Intel competes better than the comparisons suggest: foundry services. AMD and Nvidia do not manufacture chips. Intel does. In a world where the US government and European governments are actively subsidizing domestic semiconductor production, Intel’s manufacturing footprint is an asset that has no comparable equivalent among its peers.
INTC Technical Analysis: RSI, SMA, and the Chart Setup Right Now
The Intel stock technical analysis RSI SMA picture is unambiguously bullish on trend and concerning on near-term momentum.
INTC is trading above both its 50-day SMA at $59.27 and its 200-day SMA at $41.40. The price is 91% above the 50-day and 173% above the 200-day. The 20-day SMA is $86.81, and the current price of $113.01 sits 30.2% above that. The Intel stock technical analysis RSI SMA trend structure is the most constructive it has been in years.
The RSI at 85.8 is the offset. Readings above 80 on a large-cap semiconductor stock historically precede consolidation periods before the next directional move. The MACD at 3.34 is still positive, which means the trend has not reversed yet. INTC options activity is elevated, with ATM implied volatility at 84.7% and an options context score of 89 out of 100, placing current options pricing in the top 20% of the 52-week reference range. INTC options activity at these levels suggests options are expensive for buyers and theoretically favorable for premium sellers.
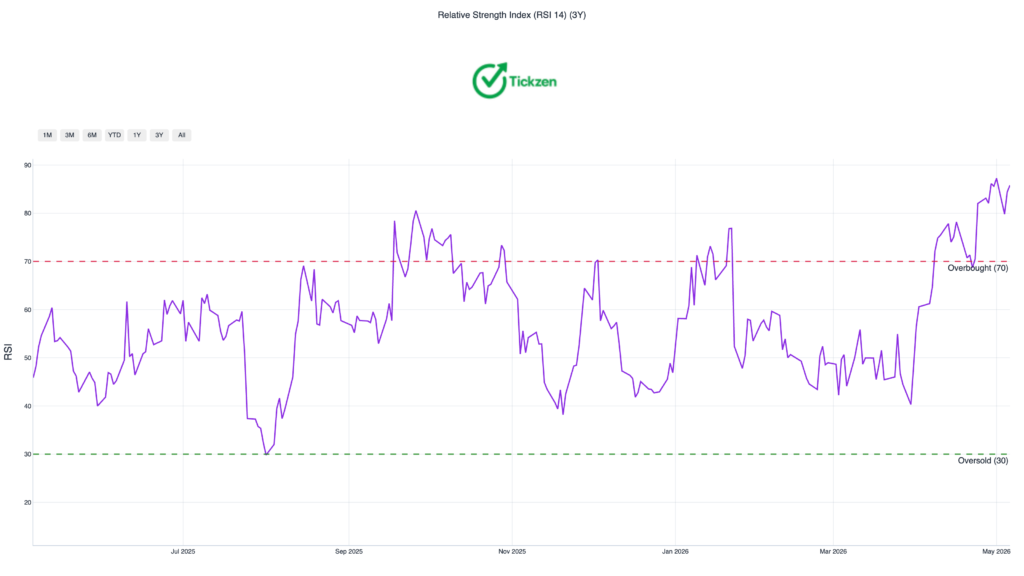
The INTC 52-week high low range of $18.97 to $113.50 tells the full story of what 2025 and 2026 looked like for this stock. The INTC 52-week high of $113.50 was hit on May 6, 2026. The stock is not in consolidation. It is at the edge of its trading range, deciding whether to break out or pull back.
Key levels to watch: $86.81 is the 20-day moving average and the most important near-term support. $64.26 is the major cluster support level tested six times historically. $59.27 is the 50-day SMA, which long-term investors would consider a favorable re-entry zone if the price corrects.
Is Intel a Good Buy in 2026: The Clear-Eyed Answer
The INTC analyst rating buy hold sell consensus is Hold from 42 analysts, with a mean target of $79.05 and a high target of $118.00. Is Intel a good buy in 2026 depends entirely on what you are buying.
If you are buying Intel’s turnaround story at $50 to $60, you are taking a calculated risk on a recoverable business with structural government support, a credible foundry technology in 18A, and real AI chip market tailwinds. Is Intel a good buy in 2026 at that entry? Yes, with appropriate position sizing and a 2 to 3 year holding period.
If you are buying Intel at $113.01 after a 74% run in 15 days, with RSI at 85.8 and analyst consensus 30% below the current price, you are paying for every positive scenario in advance. Intel stock overvalued or undervalued at $113 is not a difficult question: the DCF model and 42 analysts point to overvalued territory at the current price. The INTC stock surge 2026 has moved faster than the underlying fundamentals have improved, and that gap matters for anyone buying today rather than six months ago.
The Intel Foundry business turnaround is real. The Intel 18A process node is competitive. The US government Intel stake and the Nvidia Intel $5 billion investment are structural supports for the business. Intel semiconductor AI chips demand is a genuine long-term growth driver. None of that changes the math on the entry price.
INTC stock forecast 2026 beyond the current quarter depends on July 23, 2026 earnings delivering on DCAI revenue growth and gross margin improvement toward 40% or above. If that happens, the stock at $113 has a supportable case. If Intel posts another quarter of flat DCAI revenue and widening losses, the gap between the current price and the $79 analyst target will close faster than most investors expect.
The INTC stock surge 2026 has been one of the most dramatic large-cap recoveries in the semiconductor sector. The deals are real. The technology is competitive. The timing of profitability is the only open question, and it is a large one.
All data sourced from Tickzen.app institutional research reports on INTC. Report date: May 7, 2026. This article is for informational purposes only and does not constitute investment advice. Conduct independent research before making any investment decisions.