
By a market analyst with 12 years tracking telecom and technology stocks
Nokia’s stock has done something in 2026 that most people did not see coming. The ADR traded as low as $4.00 earlier in the year. As of May 24, 2026, NOK sits at $15.47, which means the stock has returned roughly 193% over the past twelve months. That kind of move forces a serious technical question: is this rally still healthy, or is the stock running on fumes?
I want to walk through what the charts are actually telling us right now, because the setup is more nuanced than most social media commentary suggests.
Nokia Stock Price Action in 2026: The Rally in Context
The first thing worth noting about the Nokia stock price chart is how cleanly the trend has held. The 50-day moving average sits at $10.80 and the 200-day moving average sits at $7.23. Both are well below the current price of $15.47. That kind of gap between price and long-term moving averages tells you the momentum behind this move has been unusually strong.
The 52-week range spans from $4.00 to $15.78. Nokia hit that $15.78 high on May 22, 2026, which means the stock is pressing into fresh territory right now. That is both exciting and a reason to pay attention to the details.
Over the last 15 trading sessions from May 4 to May 22, Nokia gained 17.73%. Daily volume during that stretch averaged roughly 110 million shares, which is meaningful for a stock with a float of 4.44 billion shares. Volume is what separates real breakouts from noise, and the volume here has been substantial enough to take seriously.
What the RSI Is Saying About NOK Stock Right Now
The 14-day RSI on Nokia stock currently reads 71.5. That number matters.
Anything above 70 generally gets labeled “overbought,” and 71.5 is right on that edge. For traders watching NOK stock technical indicators, this is the single most important signal to understand correctly. An overbought RSI does not mean the stock is about to crash. It means the stock has moved fast enough that a cooling period becomes more likely than not.
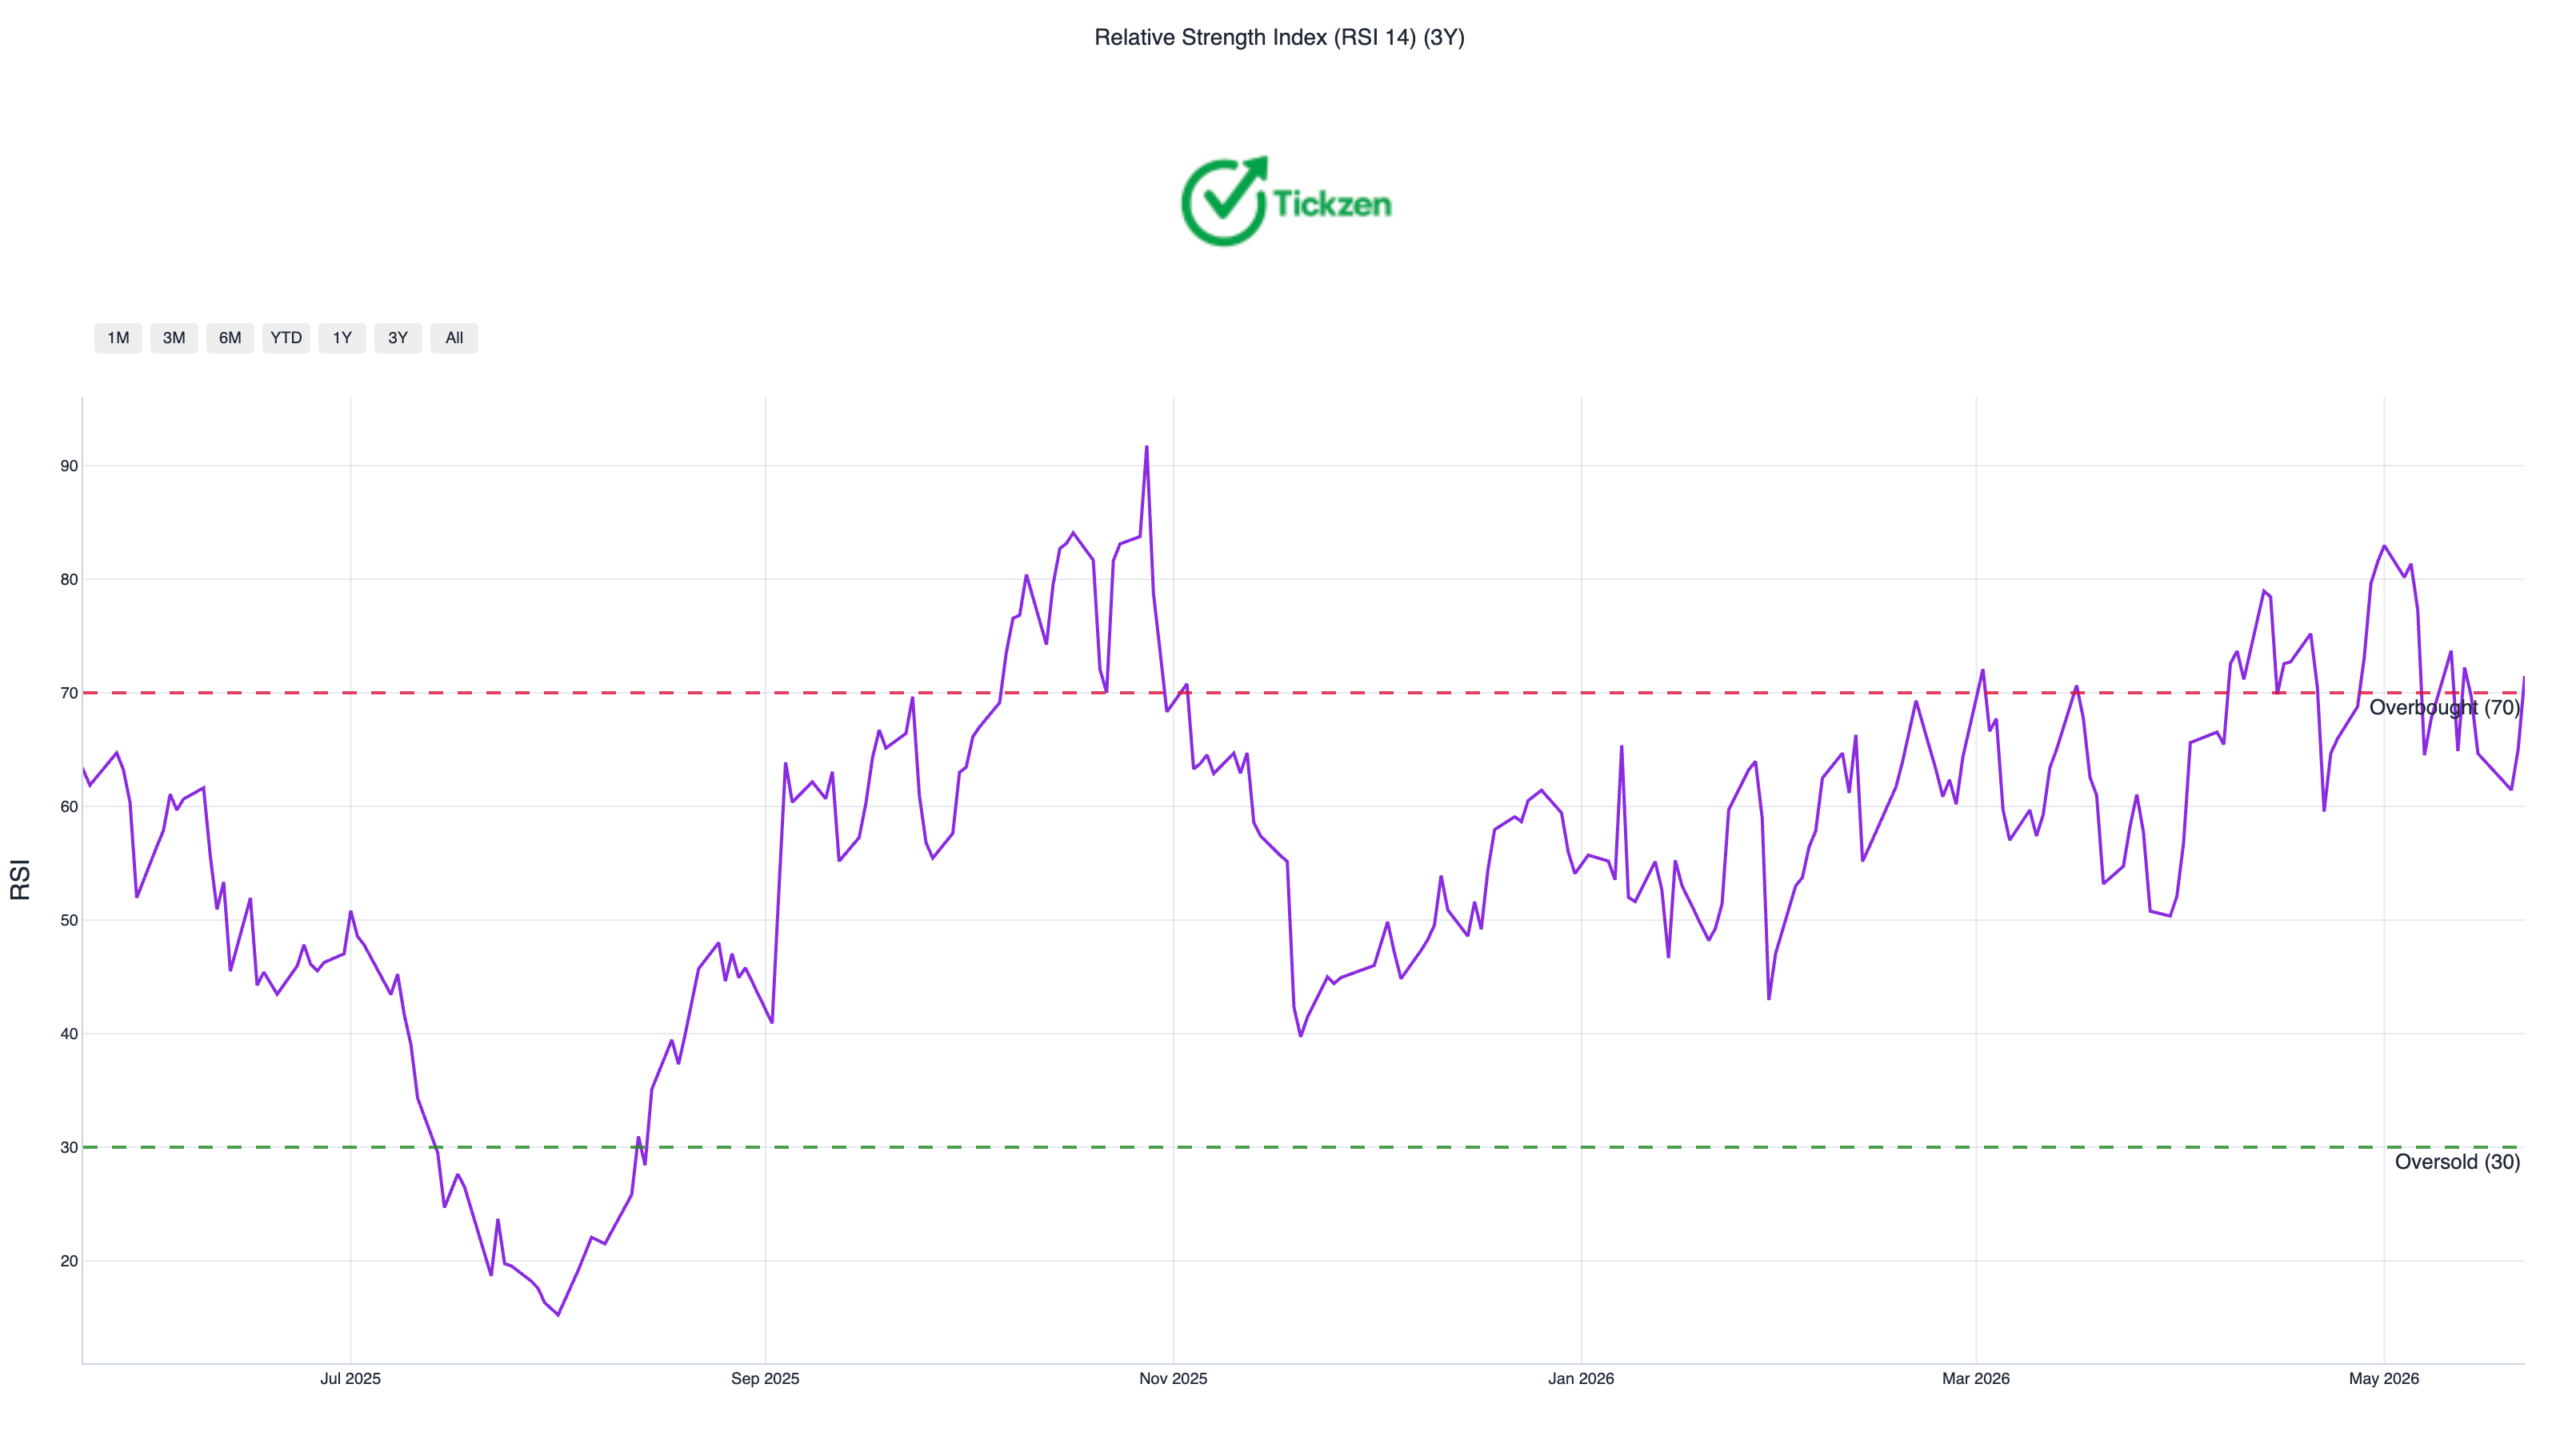
In strong uptrends, stocks can stay overbought for longer than feels comfortable. But when RSI pushes above 70 while price is pressing against the upper Bollinger Band at $15.51, the risk-reward for new buyers compresses. The upside from here to the upper band is roughly four cents. The potential downside to the 20-day moving average at $13.86 is over a dollar.
That asymmetry matters more than whether you think Nokia is a good company.
Nokia Stock Bollinger Bands and Key Price Levels
The Bollinger Band picture right now is worth spending time on. Nokia is pressing against the upper band at $15.51. That level acts as dynamic resistance in the short run, meaning the stock has to demonstrate it can close above that level on meaningful volume to signal continuation rather than reversal.
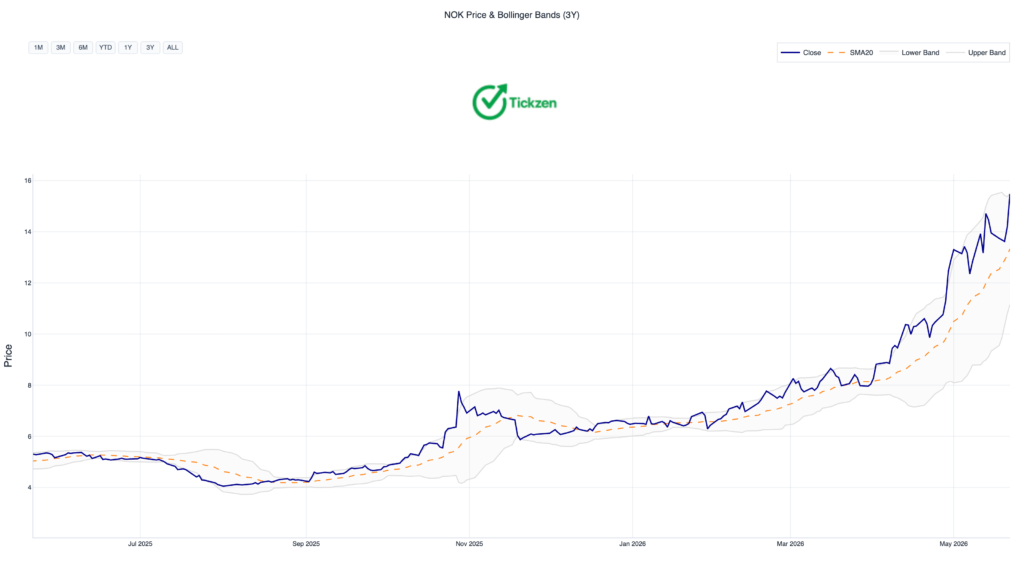
Below the current price, there are three support levels that active traders should have on their radar.
The 20-day moving average at $13.86 is the first line of defense for bulls. As long as Nokia holds above this level on a daily closing basis, the short-term uptrend remains intact. A close below $13.86 would shift the technical picture from bullish to cautious and open up a test of the next level.
The cluster support at $12.38 has been tested 19 times historically. Price levels that get tested that many times carry real weight. If Nokia were to break below $12.38, that would be a genuinely bearish technical signal because it would represent a breakdown through an area where buyers repeatedly stepped in.
The 200-day moving average at $7.23 is the longer-term safety net. A drop to that level from current prices would represent roughly a 53% decline, which sounds extreme but is worth understanding as the theoretical worst case if the trend fully reverses.
MACD and Momentum: Where NOK Stock Technical Indicators Get Complicated
The MACD reading is near zero, which the report describes as a neutral trend backdrop. This is actually a meaningful detail that a lot of retail traders overlook.
When price is making new highs but MACD momentum is flat or fading, it often means the rally is being driven more by price extension than by accelerating buying pressure. It does not mean the stock will fall. It means the conviction behind each additional dollar of upside is lower than it was earlier in the trend.
For Nokia stock technical analysis in 2026, combining this MACD signal with the overbought RSI paints a picture of a stock that has already delivered most of its near-term move. Traders who bought in the $12 to $13 range have a nice profit cushion. Traders thinking about entering now are taking on more risk for potentially less reward.
More From Tickzen:
- Delta Air Lines Stock Analysis 2026: Is DAL Stock a Good Investment Right Now?
- Micron Technology Stock in 2026: Is MU Stock a Good Buy Right Now?
- Is IREN Stock Overvalued at $61? What the Numbers Say Before You Buy
- EchoStar SATS Stock Analysis 2026: Is the 7x Rally Running Out of Steam?
- MRAM Stock Up 172% in 15 Days — Is Everspin Technologies Still Worth Buying?
Nokia Historical Volatility and What It Means for Options Traders
The 30-day historical volatility on NOK using close-to-close methodology is currently 78.9%. To put that in context, the full-history average for NOK is 33.4%. Current volatility is more than double the historical norm.
For options traders watching NOK stock implied volatility 2026, this matters a lot. The at-the-money implied volatility sits at 74.4% for the June 26, 2026 expiry, and the options market is pricing in a move of roughly plus or minus 16.4% before that date. The IV context score of 92 out of 100 means options are expensive by historical standards, which gives premium sellers a statistical edge.
The put-to-call ratio of 0.37 suggests the options market is leaning bullish, which is consistent with the broader sentiment picture. Low short interest of 1.20% of the float confirms that institutional investors are not betting heavily against the stock.
Nokia Stock Trading Strategy for Short-Term and Long-Term Investors
The technical picture calls for different responses depending on your time horizon.
If you are a short-term trader, the honest answer is that chasing Nokia at $15.47 while RSI is above 70 and the stock is pressing the upper Bollinger Band is not a high-probability setup. Waiting for a pullback to the 20-day moving average at $13.86 would give you a much better entry with a defined risk level below $12.38.
A confirmed breakout above $15.51 with volume well above the recent 110 million daily average would change that calculus and suggest the next leg higher is beginning.
If you are a long-term investor, the 200-day moving average at $7.23 anchors the trend. Nokia stock is in a genuine long-term uptrend by that measure, and any pullback that keeps price above the 50-day moving average at $10.80 would look like a normal correction within a healthy trend rather than a reason to panic.
The Bottom Line on Nokia Stock Technical Analysis
Nokia’s stock chart is bullish. That is not in dispute. The price is above both key moving averages, the trend direction is up, and volume has supported the move.
What the chart is also telling you is that the easy money in this specific leg of the rally has already been made. RSI at 71.5, price at the upper Bollinger Band, and MACD near zero is a combination that historically calls for patience over aggression.
The next strong buy signal on Nokia stock will come either from a clean breakout above $15.51 with conviction on volume, or a healthy pullback to $13.86 that holds and sets up a fresh entry with better risk-reward. Until one of those setups presents itself, the technically sound move is to watch rather than chase.
This article is for informational and educational purposes only. It does not constitute financial or investment advice. Always conduct your own research before making investment decisions.