
EchoStar Corporation has been one of the more interesting stories in telecom over the past three years. From a 52-week low of $14.90 to a recent high of $139.54, SATS stock has done things that most analysts would have called impossible back in 2023. But now, with shares trading around $137.23 and the stock pressing against technical resistance, the question worth asking is not how far it has come. The question is where it goes from here.
SATS Stock Price Today: What the Charts Are Actually Saying
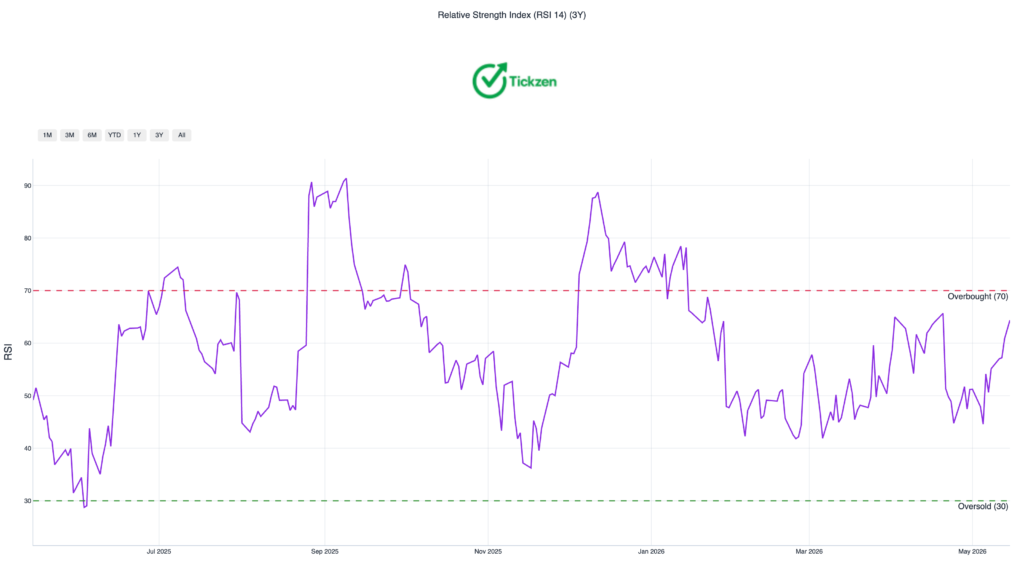
SATS is currently trading above both its 50-day moving average ($120.72) and its 200-day moving average ($92.56). In technical terms, that is a bullish alignment. The MACD indicator supports near-term upside, and the RSI sits at 64.4, which is elevated but not technically overbought.
The problem is the Bollinger Band. The stock is pressing right up against the upper band at $137.32, which historically acts as a ceiling in the short term. The stock gained 12.83% in just the last 15 trading days. That kind of pace tends to attract profit-takers, and the data reflects that. Volume has been near average, which means the rally has not been backed by the kind of institutional conviction that sustains a breakout.
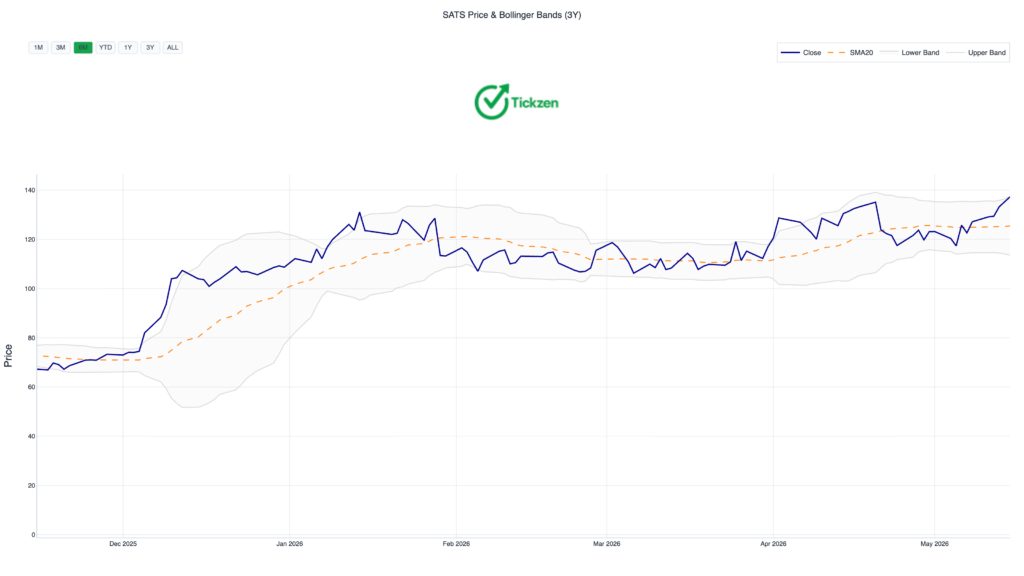
If SATS holds above the 20-day moving average at $127.79, the bulls stay in control. A break below that level opens the door to a test of $120.72. A deeper drop below $120.38, which has been tested eight times as support, would be a genuine warning sign.
Short-term traders need to be patient here. Chasing this at $137 with a 12% gain already baked in over two weeks is a low-probability trade. The smarter approach is to wait for either a confirmed breakout above $137.32 on strong volume, or a pullback to the $127 range where the risk-reward improves considerably.
EchoStar Stock Forecast: What Wall Street Analysts Think
Five analysts currently cover SATS, and their average price target is $129.60, which is actually below where the stock is trading right now. That is a -5.6% implied downside from current levels. The most bullish target on the street is $147.00, while the most cautious sits at $120.00.
The consensus recommendation is still Buy, but that disconnect between the Buy rating and the below-market price target tells you something. Analysts see the company’s long-term story as credible, but they also recognize that the stock has moved ahead of what the fundamentals currently justify.
The fair value estimate in this analysis blends multiple methodologies and lands at $127.26, roughly 7.3% below the current price. The EV/EBITDA-implied value is even lower at $98.26, while the EV/Revenue method gives you $177.11. That wide range signals something important: this is not a stock where valuation gives you a clear answer. You are essentially betting on which version of EchoStar’s future you believe in.
More From Tickzen:
- Delta Air Lines Stock Analysis 2026: Is DAL Stock a Good Investment Right Now?
- Micron Technology Stock in 2026: Is MU Stock a Good Buy Right Now?
- Is IREN Stock Overvalued at $61? What the Numbers Say Before You Buy
- Delta Air Lines Stock Valuation 2026: DCF Model, Fair Value, and the Hidden Risks Most Investors Miss
- MRAM Stock Up 172% in 15 Days — Is Everspin Technologies Still Worth Buying?
EchoStar Corporation Fundamentals: The Part Most Articles Skip
Here is where things get complicated, and most retail coverage of SATS glosses over this section entirely.
EchoStar carries $29.24 billion in debt against $1.52 billion in cash. The debt-to-equity ratio is 5.15x. Operating cash flow over the trailing twelve months is negative $67.84 million. Net income over the same period is negative $14.44 billion, which includes a large goodwill or impairment-related charge.
The return on equity is -112.28%. The current ratio is 0.30x, meaning the company’s current liabilities are more than three times its current assets. The Altman Z-Score of -0.97 puts the company in the distress zone.
None of this is a secret. The market knows all of it. The stock is still at $137 because investors are pricing in the spectrum deals, the Boost Mobile business, and the 5G network deployment story, not the trailing financials.
Revenue came in at $14.80 billion for the trailing twelve months, but revenue is declining at 5.2% year over year. Gross margin is 27.08%, and EBITDA margin is 10.72%. Those are not bad operating numbers on their own. The issue is that a mountain of debt, negative operating cash flow, and declining revenue make it very hard to get to profitability without executing near-perfectly on every front.
For long-term investors, the question is not whether the company is losing money now. The question is whether the spectrum deals, the 5G buildout, and the managed reduction in legacy DISH satellite subscribers create a path to positive free cash flow within a timeframe that the debt load allows.
SATS Short Interest: A 36% Float Short Is Hard to Ignore
Short interest in SATS is at 36.17% of the float, with 41 million shares currently sold short. The prior month figure was 33 million, meaning short interest grew by roughly 24% in a single month.
A days-to-cover ratio of 6.7x means it would take almost seven days of average volume for all short sellers to exit their positions. That is not extreme by short squeeze standards, but it is high enough to create meaningful volatility if positive news forces covering.
The recent FCC approval of the spectrum sales to SpaceX and AT&T, which together represent more than $40 billion in deal value according to Benzinga reporting, was exactly the kind of catalyst that forces short sellers to react. The stock surged on that news, and the short interest data from April 30 predates that approval, so the actual current short position could be different.
The 111.19% institutional ownership figure is unusual. It happens when multiple entities report overlapping ownership stakes, often due to derivative positions or counting methodologies. It does not mean 111% of shares are owned, but it does reflect heavy institutional involvement in the stock.
Is SATS Stock a Good Buy Right Now?
The honest answer is: it depends entirely on your time horizon and your appetite for complexity.
If you are a short-term trader, the technicals suggest waiting for a cleaner entry. The stock is extended, pressed against resistance, and has already run 12.83% in two weeks. A pullback to $127-$128 would offer a better setup.
If you are a long-term investor, the case for SATS rests on the spectrum monetization, the FCC-approved deals, and the eventual path to free cash flow positive. The risk is the $29.24 billion debt pile, which has a cost in an environment where rates are not zero. The next earnings report on July 30, 2026 will be closely watched for any guidance on the path to profitability.
If you are new to the stock and considering a first position, the advice here is to wait. Not because the company is necessarily going lower, but because the risk-reward at current levels is asymmetric in the wrong direction. A 5.6% analyst-implied downside with a 53.8% 30-day historical volatility means the downside scenarios are considerably more painful than the implied price targets suggest.
Key Takeaways on EchoStar SATS Stock Analysis
EchoStar’s stock price performance over the past year has been driven by restructuring, spectrum deals, and a market that is willing to pay for the optionality embedded in a 5G wireless and satellite business. The technicals are bullish but stretched. The fundamentals are complicated by debt and negative cash flow. Analyst consensus says Buy but targets below where the stock is currently trading.
The July 2026 earnings report is the next real test. Until then, the stock is likely to move on news flow rather than fundamentals, which makes it a story stock more than a value stock. That is not a bad thing. It just means you need to understand what you own.
This article is for informational purposes only and does not constitute financial or investment advice. Always conduct your own research and consult a qualified financial advisor before making any investment decisions.