If you follow airline stocks even loosely, you have probably noticed Delta Air Lines showing up in a lot of conversations lately. And for good reason. As of May 16, 2026, $DAL stock is trading at 70.23 dollars, Berkshire Hathaway just disclosed a massive new position worth over 2.6 billion dollars, and 25 Wall Street analysts are calling it a Strong Buy with a mean price target of 80.09 dollars. That is 14 percent upside from the current price before you even start running your own models.
But here is the thing about airline stocks. They have a way of looking attractive on the surface while hiding some genuinely uncomfortable risks underneath. So rather than just repeating the bullish narrative, I want to walk through everything the data actually says about Delta Air Lines stock in 2026, including the parts that should make you pause before sizing into a position.
$DAL Stock Price and Current Technical Setup: What the Charts Are Saying
The first thing to understand about $DAL stock right now is that the technical picture is bullish at the macro level but mixed at the micro level. The stock is trading above both its 50-day moving average at 67.12 dollars and its 200-day moving average at 64.21 dollars. That two-layer alignment above the longer-term trend is genuinely constructive and tells you the broader price structure is healthy.
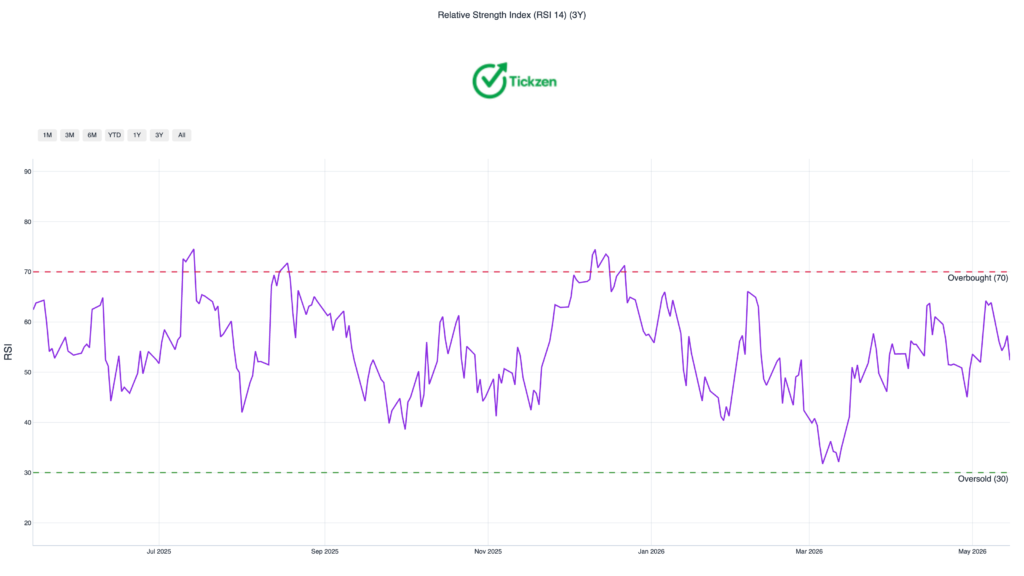
But zoom in a little and the picture gets more nuanced. The 20-day moving average sits at 70.21 dollars, and $DAL is essentially hugging that level right now. The RSI at 52.4 is neutral, not overbought, not showing strong momentum in either direction. The MACD histogram is near zero. These shorter-term indicators are telling you momentum has flattened and the stock is at a bit of a decision point.
The key levels to watch are straightforward. If $DAL holds above 70.21 dollars the bullish trend continues and the next realistic upside target is 73.89 dollars. If it breaks below 70.21, the next logical landing zone is 68.30 dollars, a level that has been tested 13 times in the past 30 days and has held as real support. A break below 68.30 would open the door to a deeper correction toward the 200-day moving average at 64.21 dollars.
One thing worth noting is that the recent price gains have not been accompanied by expanding volume. The stock gained 3.25 percent over a 15-day period from late April into mid-May 2026, but average daily volume sat around 7.1 million shares, roughly in line with or below the 20-day average. Rallies without volume expansion tend to be fragile. That does not mean the trend reverses, but it does mean you want confirmation before adding aggressively.
More From Tickzen:
- NBIS Stock Analysis 2026: Is Nebius Group Worth Buying After a 508% Run?
- Micron Technology Stock in 2026: Is MU Stock a Good Buy Right Now?
- Is IREN Stock Overvalued at $61? What the Numbers Say Before You Buy
- Rocket Lab Stock Analysis 2026: Is RKLB Worth Buying at $105 or Is It Priced for Perfection?
- INTC Stock Surge 2026: How the Intel Apple Chip Deal Changed Wall Street’s View
Delta Air Lines Valuation: Is DAL Stock Undervalued in 2026?
This is where the Delta Air Lines investment thesis gets genuinely interesting, and honestly where most of the recent institutional buying probably originates.
At a trailing price to earnings ratio of 10.25 and a forward PE of 8.78, Delta is trading at a pretty significant discount to the broader market. The S&P 500 typically trades somewhere in the 20 to 22 times forward earnings range. Delta is trading at less than half that multiple. The PEG ratio comes in at 0.21, which is remarkably low. A PEG below 1 generally indicates the market is not pricing in available growth. At 0.21 it suggests the market is dramatically undervaluing the earnings growth trajectory relative to where the stock is priced.
The price to sales ratio of 0.71 and EV to revenue of 0.95 mean you are buying 65 billion dollars in annual revenue for less than one times that revenue. In most industries this would be considered deeply cheap. In airlines it is fairly typical because the market has historically and rightly applied a discount to cyclical businesses with heavy debt loads.
The blended fair value estimate using three methodologies comes out to 96.77 dollars per share, which represents 37.8 percent upside from the current price of 70.23. That blended figure pulls from a DCF base case of 102.50 dollars, the median analyst consensus target of 80 dollars, and an EV to revenue multiple approach yielding 121.70 dollars. The fact that all three independent approaches converge on a number meaningfully above where DAL stock trades today is noteworthy.
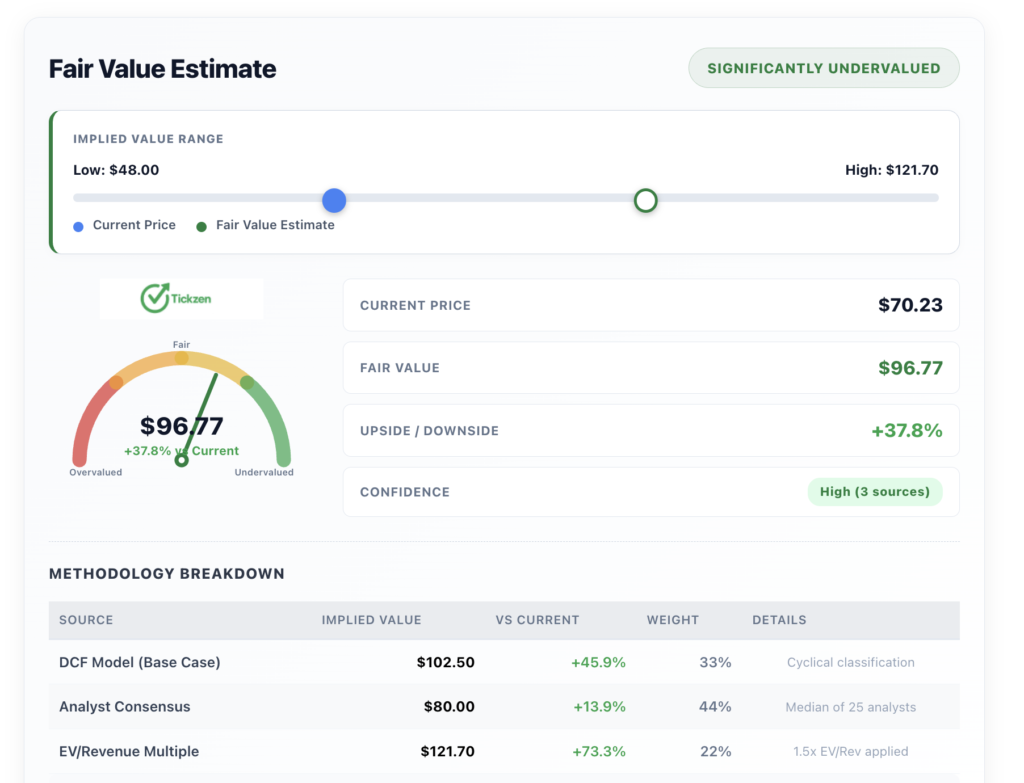
The DCF model specifically is worth understanding because it uses a 9.2 percent WACC with a 1.5 percent terminal growth rate and a free cash flow base of 3.09 billion dollars. At those assumptions and current growth, the market is only pricing in FCF growth of 1.4 percent per year over the next decade to justify a price of 70.23 dollars. Given that revenue grew 12.9 percent year over year in the most recent quarter, 1.4 percent implied FCF growth looks very conservative.
Delta Air Lines Fundamentals and Financial Health: The Strengths and the Warning Signs
Revenue, Earnings, and Cash Flow
On revenue, Delta generated 65.18 billion dollars over the trailing twelve months with the most recent quarter showing 15.85 billion in revenue and year over year growth of 12.9 percent. Net income for the trailing twelve months came in at 4.48 billion dollars, producing a net profit margin of 6.87 percent.
The cash flow picture is strong. Operating cash flow over the trailing twelve months was 8.40 billion dollars. Levered free cash flow was 3.09 billion dollars. The most recent quarter produced free cash flow of 1.23 billion dollars. For a business the size of Delta, those are real numbers that reflect an operation capable of funding growth, servicing debt, and returning capital to shareholders simultaneously.
Return on equity of 24.99 percent and return on invested capital of 12.80 percent show that Delta is using its capital efficiently and generating genuine value from its asset base. The inventory turnover of 30 times annually and days sales outstanding of just 16 days show that operationally the business runs tightly.
The Debt Situation and Liquidity Risk in DAL Stock
Here is where intellectual honesty requires us to slow down. Delta carries 21.40 billion dollars in total debt against 5.05 billion in cash, leaving a net debt position of approximately 16.35 billion dollars. The debt to equity ratio is 1.05.
More concerning for short-term analysis is the current ratio of 0.42 and quick ratio of 0.28. Both are well below 1.0, meaning current liabilities significantly exceed current assets. This is not unusual for airlines, which typically sell tickets before flights operate and run on negative working capital structures. But it does mean Delta is reliant on continued revenue flow and credit facilities to meet short-term obligations. If travel demand softens meaningfully, the liquidity squeeze becomes a real issue quickly.
The Altman Z-Score of 0.55 places Delta formally in the distress zone. The threshold for financial distress is typically below 1.81. A score of 0.55 is not borderline, it is deep in distress territory by the metric. Now, the Altman Z-Score was designed before airlines existed as an industry structure, and many argue it is a flawed lens for capital-intensive cyclical businesses. The 8.4 billion dollars in operating cash flow suggests the business is far from operationally distressed. But the score is a flag worth taking seriously as a risk signal rather than dismissing entirely.
Why Berkshire Hathaway Buying Delta Air Lines Stock Matters for DAL Investors
Berkshire Hathaway disclosed in May 2026 that it bought over 2.6 billion dollars worth of Delta Air Lines stock during Q1 2026. This was one of Greg Abel’s first major portfolio moves after taking over as CEO from Warren Buffett. At the same time, Berkshire sold out of Visa, Mastercard, Domino’s Pizza, Amazon, and United Healthcare.
That context matters. Berkshire did not accidentally stumble into a 2.6 billion dollar position in an airline stock. Airlines are famously difficult businesses. Buffett himself famously said at one point that investors would have been better off if someone had shot down Orville Wright’s plane at Kitty Hawk. For Berkshire to make Delta one of the first major purchases under new leadership is a statement about the quality of the business relative to price.
At a forward PE of 8.78 and with 8.4 billion in annual operating cash flow, Delta fits the profile of the kind of cash-generating, dominant-franchise business that Berkshire has historically gravitated toward when it perceives the market is mispricing quality.
The institutional ownership overall sits at 83.79 percent of shares outstanding. That means the majority of DAL stock is already held by sophisticated, long-duration investors who have done the work and chosen to own it.
DAL Stock vs Airline Peers: How Delta Compares to UAL, LUV, and AAL
Delta Air Lines stock does not exist in isolation. To judge it fairly you need to compare it against the peer group.
Delta leads on market capitalization at 46.14 billion dollars versus United Airlines at 30.14 billion, Southwest Airlines at 18.82 billion, and American Airlines at 8.14 billion. Delta also leads on net margin at 6.87 percent versus United at 6.06 percent and Southwest at 2.83 percent. American Airlines sits at just 0.36 percent net margin, which tells you how thin the edge is for poorly positioned carriers.
On return on equity, Delta and United are the clear standouts. Delta ROE of 24.99 percent versus United at 25.73 percent, with Southwest trailing significantly at 10.06 percent. American Airlines shows no meaningful ROE to report.
On leverage, Delta’s 1.05 debt to equity compares favorably to United’s 1.95. Delta is the most financially disciplined of the major network carriers while still commanding the largest market cap and generating the most revenue growth among peers at 12.9 percent year over year.
Delta Air Lines Stock Forecast and Analyst Price Targets for 2026 to 2027
The analyst community covering DAL stock is about as unanimous as they get in this industry. Twenty-five analysts cover the stock and the consensus is Strong Buy. The mean price target is 80.09 dollars, the median is 80 dollars, and the high target is 95 dollars. Even the low analyst target of 48 dollars represents downside that is relatively contained given the operating cash flow base of the business.
The July 9, 2026 earnings report will be an important catalyst. Q1 2026 showed a net loss of 290 million dollars and EPS of negative 0.44, which spooked some investors given the quarter over quarter decline of 123.7 percent in net income. But it is critical to understand that Q1 is seasonally the weakest quarter for airlines historically. Comparing Q1 to Q4 with its holiday travel boost is not the right lens. What matters is whether the summer travel season shows the revenue trajectory continuing to build, and with revenue growing 12.9 percent year over year the underlying demand signal is intact.
DAL Stock Risk Assessment: What Could Go Wrong
Delta Air Lines stock carries a beta of 1.25, meaning it moves roughly 25 percent more than the broader market in both directions. The 30-day historical volatility sits at 28.2 percent annualized. The maximum historical drawdown on DAL stock is negative 69.18 percent. That is not a minor correction, that is a business that can lose two-thirds of its value in an adverse cycle.
The value at risk at the 5 percent confidence level is negative 3.12 percent in a single period, and at the 1 percent confidence level it reaches negative 5.98 percent. The Sharpe ratio of 0.18 and Sortino ratio of 0.24 suggest the risk-adjusted returns have historically been modest relative to the volatility taken on.
The implied options market is pricing an expected move of plus or minus 9.6 percent, or about 6.80 dollars, around the June 12, 2026 expiry with ATM implied volatility at 45.2 percent. That elevated implied volatility scoring 77 out of 100 on the context scale suggests the options market is pricing in above-average uncertainty.
For a long-term investor the key question is whether 8.4 billion in annual operating cash flow and 65 billion in revenue growing at nearly 13 percent per year provides enough fundamental anchor to justify owning through the volatility. That is ultimately a personal risk tolerance decision, but the business quality metrics suggest it does.
Final Thoughts: Should You Buy DAL Stock in 2026?
Delta Air Lines is not a simple story. The business generates serious cash, the valuation is genuinely cheap relative to earnings and growth, institutional ownership is dominant at 83.79 percent, Berkshire just paid 2.6 billion dollars to own a piece of it, and 25 analysts collectively say buy with a target of over 80 dollars.
Against that, the balance sheet carries 21.4 billion in debt, the liquidity ratios are weak, the Altman Z-Score flags financial distress, Q1 2026 produced a net loss, and the stock has historically drawn down nearly 70 percent in bad cycles.
For long-term investors who can tolerate that volatility and have a 3 to 5 year horizon, the combination of a 8.78 forward PE, a 0.21 PEG ratio, and a 37.8 percent gap between current price and blended fair value makes a compelling case that DAL stock is undervalued in 2026. For shorter-term traders, the technical setup requires confirmation above 73.89 dollars with real volume before it becomes a clean directional trade.
The July 9 earnings report is the next major inflection point. Watch whether revenue growth sustains above 10 percent year over year and whether free cash flow continues building from the 1.23 billion quarterly base. Those two data points will either validate or challenge the bull thesis heading into the second half of 2026.
Disclosure: This article is for informational and educational purposes only. It does not constitute financial or investment advice. All investment decisions should be made in consultation with a qualified financial advisor after conducting independent due diligence. All data sourced from the DAL stock analysis report dated May 16, 2026.