Delta Air Lines stock trades 37 percent below its blended fair value estimate. Here is the full breakdown of the DAL DCF valuation, risk factors, and what the options market is telling us right now
There is a particular kind of stock that attracts serious long-term investors. It generates real cash. It dominates its industry. It trades at a multiple the broader market would consider embarrassingly cheap. And yet most casual investors walk right past it because the industry sounds scary or the balance sheet looks messy on the surface.
Delta Air Lines stock in 2026 fits that description almost perfectly. At a current price of 70.23 dollars the stock trades 37.8 percent below a blended fair value estimate of 96.77 dollars, carries a forward price to earnings ratio of 8.78, generates 8.40 billion dollars in annual operating cash flow, and just attracted a 2.6 billion dollar position from Berkshire Hathaway. Twenty-five Wall Street analysts rate it a Strong Buy with a mean price target of 80.09 dollars.
But Delta Air Lines also carries 21.40 billion dollars in debt, posted a net loss in Q1 2026, has a current ratio of just 0.42, and an Altman Z-Score of 0.55 that formally puts it in financial distress territory. Understanding both sides of that equation is what separates informed investing in DAL stock from blind optimism.
This article walks through the full valuation picture, the DCF model mechanics, the risk factors, and what the options market is actually pricing in for DAL stock through mid-2026.
Delta Air Lines Fair Value Estimate: How Did We Arrive at 96.77 Dollars?
The blended fair value of 96.77 dollars for DAL stock is not a single model output. It is a weighted average of three independent methodologies, each anchored to real data and each arriving at a number meaningfully above the current stock price of 70.23 dollars.
DCF Model Base Case: 102.50 Dollars Per Share
The discounted cash flow model uses a 10-year, three-tier growth deceleration framework. Years one through three are anchored to observed revenue growth. Years four through seven apply 50 percent of that initial rate. Years eight through ten apply 25 percent of the original rate. A terminal growth rate of 1.5 percent is applied after year ten.
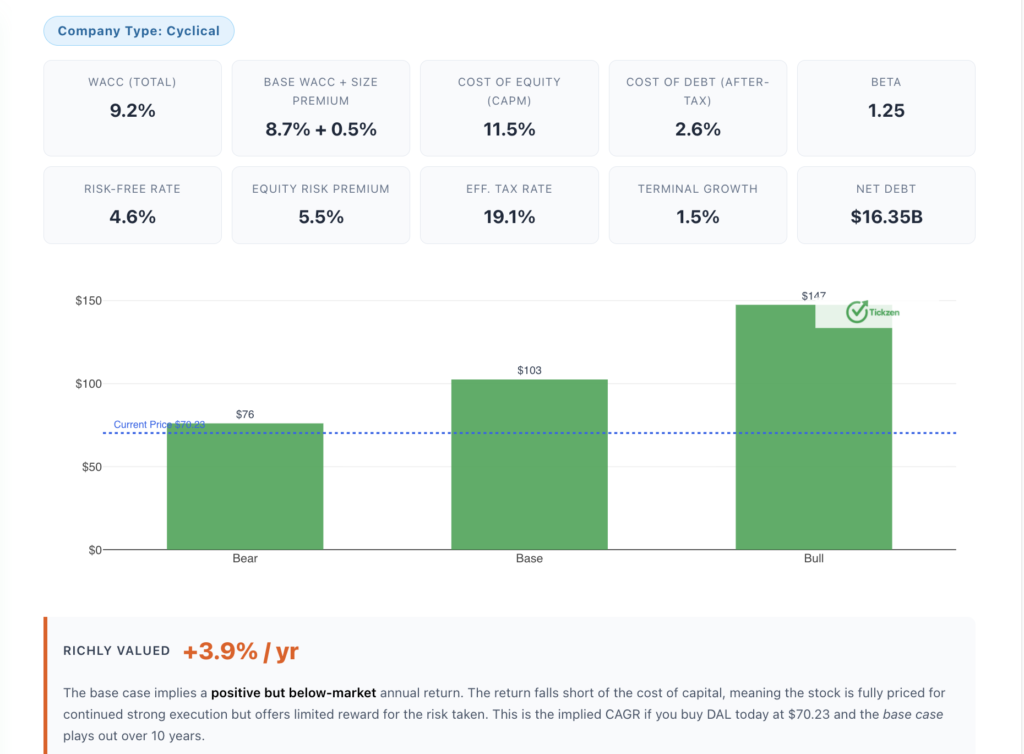
The free cash flow base used in the model is 3.09 billion dollars, confirmed by two consecutive strong quarters of FCF generation. The WACC is 9.2 percent, built from a cost of equity of 11.5 percent using CAPM with a risk-free rate of 4.6 percent, an equity risk premium of 5.5 percent, and a beta of 1.25. The after-tax cost of debt is 2.6 percent based on an effective tax rate of 19.1 percent.
Under the base case these inputs produce an intrinsic value of 102.50 dollars per share, representing 45.9 percent upside from the current price of 70.23 dollars. That base case scenario is weighted at 33 percent in the blended estimate.
One of the most useful outputs from this DCF analysis is the market-implied FCF growth rate. At a current price of 70.23, using a WACC of 9.2 percent and a 1.5 percent terminal rate, the market is only pricing in FCF growth of 1.4 percent per year over the next decade.
Given that Delta grew revenue 12.9 percent year over year most recently and generated 3.09 billion in levered free cash flow over the trailing twelve months, a market-implied FCF growth assumption of 1.4 percent looks very pessimistic. That gap between what the market is pricing in and what the business is actually delivering is the core of the bull thesis.
The DCF sensitivity table is also worth studying. At a WACC of 9.2 percent and 8 percent five-year FCF growth, the intrinsic value comes to 102.52 dollars. If you are willing to assume the WACC could reasonably be 8.2 percent given declining rate expectations, the same 8 percent FCF growth scenario produces a value of 122.36 dollars. On the downside, even at a 10.2 percent WACC with 5 percent growth, the model produces 76.22 dollars, still above the current price.
Analyst Consensus Valuation: 80.00 Dollars Median Target
The median price target from 25 professional analysts covering Delta Air Lines is 80 dollars per share, with the mean sitting at 80.09. Individual targets range from 48 dollars on the low end to 95 dollars on the high end. The median analyst target carries the highest weight at 44 percent of the blended estimate because it represents the collective view of professionals with direct access to management and proprietary models.
Even the most bearish analyst target of 48 dollars, which is the outlier low in the distribution, is not dramatically below today’s price. That floor gives you a sense of the downside the professional community considers realistic.
EV to Revenue Multiple: 121.70 Dollars Implied Value
Applying a sector-adjusted EV to revenue multiple of 1.5 times to Delta’s current revenue base produces an implied stock price of 121.70 dollars, representing 73.3 percent upside from the current price. This methodology carries the lightest weighting at 22 percent in the blended estimate because revenue multiples for airlines are famously compressed and applying a 1.5 times multiple is generous by industry standards. Delta’s current EV to revenue is just 0.95 times. The 1.5 times applied in this scenario is a normalized sector benchmark, not a stretch valuation.
Blending all three methodologies with their respective weights, the implied fair value of DAL stock lands at 96.77 dollars, with a confidence classification of high based on the convergence of three independent sources.
More From Tickzen:
- NBIS Stock Analysis 2026: Is Nebius Group Worth Buying After a 508% Run?
- Micron Technology Stock in 2026: Is MU Stock a Good Buy Right Now?
- Is IREN Stock Overvalued at $61? What the Numbers Say Before You Buy
- Rocket Lab Stock Analysis 2026: Is RKLB Worth Buying at $105 or Is It Priced for Perfection?
- INTC Stock Surge 2026: How the Intel Apple Chip Deal Changed Wall Street’s View
Delta Air Lines Revenue Growth and Profitability: The Numbers That Drive the Thesis
Understanding whether the fair value estimate is credible requires understanding the underlying business performance that feeds those models.
Delta generated 65.18 billion dollars in trailing twelve-month revenue with 12.9 percent year over year quarterly revenue growth. This is not a slow-moving business grinding out 3 or 4 percent annual gains. It is an operation with real growth momentum coming out of the post-pandemic travel recovery cycle.
On profitability, the gross margin is 19.90 percent, producing 12.97 billion in gross profit. EBITDA came in at 7.78 billion with an EBITDA margin of 11.93 percent. Net income for the trailing twelve months reached 4.48 billion, a net profit margin of 6.87 percent. For every 100 dollars of revenue Delta brings in, it retains 6.87 dollars as net profit. In the airline industry, where margins are historically razor thin, that is a meaningful competitive advantage.
The operating margin of 3.18 percent looks modest in isolation but is significantly better than most airline peers. American Airlines net margin sits at 0.36 percent. Southwest at 2.83 percent. Delta at 6.87 percent is not just leading, it is lapping the field on earnings quality.
Return on equity of 24.99 percent and return on invested capital of 12.80 percent confirm that Delta is creating genuine value with the capital it employs. Those are not the numbers of a capital-destroying airline. They are the numbers of a well-run business that consistently earns above its cost of capital.
DAL Stock Risk Factors: The Part Most Buy Articles Skip
The Liquidity Problem
Delta’s current ratio is 0.42. The quick ratio is 0.28. Both of these are well below 1.0, which means Delta’s current liabilities are more than double its current assets. The business compensates for this by generating enormous operating cash flows, 8.40 billion annually, but the structural liquidity weakness means any meaningful revenue shock creates pressure fast.
Airlines sell seats before they fly them. That accounting structure means cash comes in before services are delivered, which creates the negative working capital dynamic you see in these ratios. It is not unique to Delta. But it is a real risk in any scenario where demand drops suddenly. A recession, a pandemic, a major geopolitical event that shuts down travel corridors could flip these liquidity numbers from manageable to critical quickly.
The Debt Load
Delta carries 21.40 billion dollars in total debt. With 5.05 billion in cash, net debt sits at approximately 16.35 billion. The enterprise value of 62.49 billion versus a market cap of 46.14 billion shows you precisely how much of the company belongs to creditors rather than equity holders. In a rising interest rate environment or a refinancing cycle where rates are elevated, this debt load becomes increasingly expensive to service.
The debt to equity ratio of 1.05 is actually more moderate than United Airlines at 1.95 or the pre-bankruptcy American Airlines figures. But it is still 21.40 billion in real obligations that must be serviced regardless of whether summer travel demand exceeds expectations or disappoints.
The Altman Z-Score Signal
The Altman Z-Score of 0.55 places Delta formally in what the model calls the distress zone. To put that in context, scores above 2.99 indicate financial safety, scores between 1.81 and 2.99 are a gray zone, and scores below 1.81 represent distress. At 0.55 Delta sits well below even the distress threshold.
The important caveat here is that the Altman Z-Score was designed for manufacturing companies and applies poorly to capital-intensive service businesses like airlines. The model penalizes low current ratios and high debt loads without adequately accounting for predictable, large-scale operating cash flows. Delta’s 8.40 billion in operating cash flow is the real solvency signal, not the Z-Score. But institutional risk management systems often run this metric, and a 0.55 score can affect how certain funds are able to hold the stock.
The Q1 2026 Earnings Miss
The most recent quarter showed a net loss of 290 million dollars and diluted EPS of negative 0.44. Quarter over quarter net income fell 123.7 percent. For investors who looked only at the quarterly headline and not the seasonal context, this was alarming.
The reality is that Q1 is seasonally the weakest quarter for airlines. The holiday travel season ends in January, business travel tapers in the first months of the year, and spring break demand is not enough to fully offset the seasonal softness. Comparing Q1 net income to Q4 is comparing apples to oranges in this industry. The trailing twelve-month picture, which shows 4.48 billion in net income and 6.87 percent net margins, is the more meaningful read on the business.
The July 9, 2026 earnings report covering Q2 will be the real test. Q2 and Q3 are historically the strongest quarters for airline earnings. If Delta delivers a meaningful revenue and earnings recovery in the summer quarter, the Q1 loss becomes noise. If Q2 disappoints, the risk case starts getting more serious attention.
Options Market Signals for DAL Stock: What Implied Volatility Tells Us
The options market is pricing an expected move of plus or minus 9.6 percent, or about 6.80 dollars, around the June 12, 2026 options expiry. The ATM implied volatility is 45.2 percent, with call implied volatility at 46.9 percent and put implied volatility at 43.5 percent.
The IV context score of 77 out of 100, based on a 52-week realized volatility range of 29 to 50 percent, indicates that implied volatility is elevated but not at extreme levels. The options signal is classified as elevated. What that practically means is that the options market is pricing above-average uncertainty into near-term DAL moves. Premium sellers may find slightly favorable conditions, while premium buyers are paying up for that uncertainty.
The put to call ratio of 0.60 is mildly bullish. A ratio below 1.0 means more calls than puts are being traded, suggesting that options participants on net are positioned for upside. The composite sentiment score from all sources, news, analyst consensus, and options activity, comes out to 0.39 with a positive classification but only 47.1 percent confidence. The hedged and tentative character of that sentiment reading is consistent with a market that sees the bull case clearly but is not ready to ignore the balance sheet risks.
Delta Air Lines Dividend and Shareholder Returns: What Income Investors Should Know
Delta currently pays an annual dividend of 0.75 dollars per share, yielding 1.07 percent at the current price of 70.23 dollars. That yield is below the five-year average of 2.30 percent, reflecting the significant price appreciation the stock has seen over the past year, up 39.6 percent on a twelve-month basis.
The payout ratio of 10.40 percent is notably low. Delta is paying out just ten cents of every dollar of earnings in dividends, retaining 90 percent of earnings for debt reduction, reinvestment, and growth. This conservative payout structure creates a strong runway for dividend increases as the business continues generating cash.
For income investors, the 1.07 percent yield is not a compelling standalone reason to own the stock. But the low payout ratio is a signal that if management chooses to grow the dividend meaningfully, the capacity to do so without straining the balance sheet is clearly present. The ex-dividend date of May 14, 2026 has just passed, so the next dividend cycle is ahead.
The Berkshire Hathaway Factor and What It Means for DAL Stock
The significance of Berkshire Hathaway allocating over 2.6 billion dollars to Delta Air Lines cannot be understated in the context of this investment thesis. Berkshire, under new CEO Greg Abel, simultaneously exited positions in Visa, Mastercard, Domino’s Pizza, Amazon, and United Healthcare to fund new positions in Delta and a few other names. This is not a passive rebalance. It is a deliberate statement about where value sits in the current market.
Berkshire has a long institutional memory of airline investing. The firm famously invested in multiple airlines in 2016 only to sell completely in 2020 during the pandemic. The fact that Berkshire is returning to the sector with this kind of conviction, specifically in Delta, signals a view that the post-pandemic operating environment for the best-positioned carriers has fundamentally improved.
Institutional ownership of DAL stock overall sits at 83.79 percent. Short interest is just 3.59 percent of the float, down slightly from 24 million shares the prior month to 23 million. The short ratio of 2.2 days to cover is low, meaning short sellers do not have significant control over the stock and a short squeeze is not the primary catalyst story here. The story is simpler. The fundamentals are strong, the valuation is cheap, and institutional capital is accumulating.
Investment Outlook for DAL Stock Through 2026 and Into 2027
Pulling this all together, here is the honest picture for Delta Air Lines stock.
The bull case rests on a forward PE of 8.78 being too cheap for a business growing revenue at 12.9 percent with 4.48 billion in net income and 8.40 billion in operating cash flow. The blended DCF and analyst consensus puts fair value at 96.77 dollars, the strong buy consensus from 25 analysts points to 80.09 as a near-term target, and Berkshire’s 2.6 billion dollar commitment provides institutional credibility to the thesis.
The bear case centers on 21.40 billion in debt in a rate-sensitive environment, a current ratio of 0.42 that leaves little cushion if revenue softens, an Altman Z-Score of 0.55 in distress territory, and a stock that historically has drawn down 69 percent in adverse conditions. The beta of 1.25 means if the broader market corrects 20 percent, Delta tends to correct 25 percent.
The most sensible framework for approaching DAL stock in 2026 is to size your position relative to that risk. If the July 9 earnings report confirms summer travel demand is robust and quarterly free cash flow is growing from the 1.23 billion Q1 base, the fundamental case becomes materially stronger. If the 73.89 dollar technical level breaks with real volume expansion, the near-term price momentum aligns with the fundamental value story.
That combination, strong Q2 earnings plus a technical breakout above 73.89 with volume, would be the highest-confidence setup for new buyers. Until then, current holders have a well-supported long-term thesis. New investors have a compelling valuation but should be patient about entry timing.
Disclosure: This article is for informational and educational purposes only and does not constitute financial or investment advice. All data referenced is sourced from the Delta Air Lines stock analysis report dated May 16, 2026. Investors should conduct independent due diligence and consult a qualified financial advisor before making any investment decisions.